#USDJPY @ 134.270 bounces off weekly low to pare intraday losses, portrays two-day downtrend., @nehcap view: Limited upside expected (Pivot Orderbook analysis)
…
This is a premium post.
[s2If !current_user_can(access_s2member_level4)]Please register for FREE REGISTER to read full post below containing analysis. In case of any error or you think you are not able to read the full post below, please email us at support#nehcap.com [lwa][/s2If] [s2If current_user_can(access_s2member_level1)]
- USD/JPY bounces off weekly low to pare intraday losses, portrays two-day downtrend.
- Convergence of 200-EMA, short-term support lines highlights 133.90 as the key support.
- Yen pair’s recovery remains elusive below 135.40 hurdle.
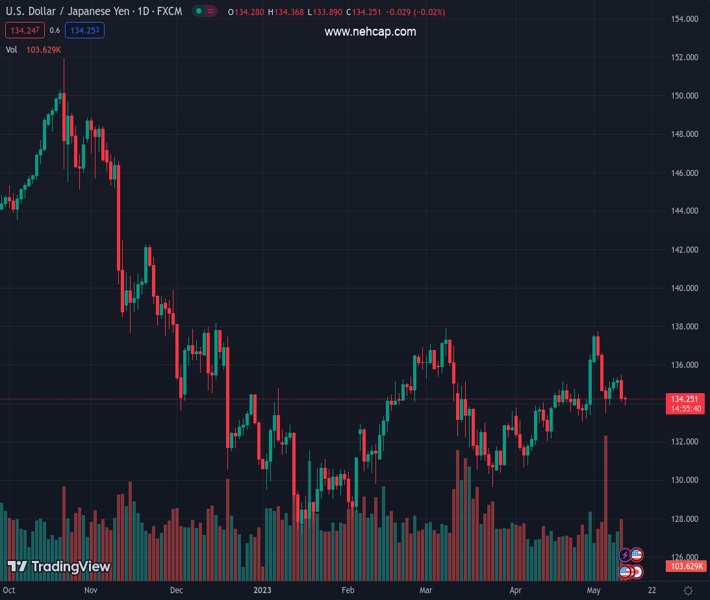
The pair currently trades last at 134.270.
The previous day high was 135.47 while the previous day low was 134.11. The daily 38.2% Fib levels comes at 134.63, expected to provide resistance. Similarly, the daily 61.8% fib level is at 134.95, expected to provide resistance.
USD/JPY picks up bids to recover from the intraday low, as well as the weekly bottom, as markets remain in consolidation mode during early Thursday. Even so, the Yen pair remains mildly offered near 134.20, printing a two-day losing streak by the press time.
That said, the quote’s failure to cross an 11-week-old horizontal resistance area joined downbeat US inflation numbers to trigger the USD/JPY pair’s U-turn from the weekly high on Wednesday.
The following losses, however, failed to conquer a convergence of the 200-day Exponential Moving Average (EMA), a two-week-old ascending trend line and an upward-sloping support line from March 24, close to 133.90.
It should be noted that the MACD indicator flashes bearish signals and hence the USD/JPY rebound appears elusive, which in turn requires the bulls to cross the aforementioned horizontal resistance area surrounding 135.30-40 to retake control.
Following that, a run-up towards 136.50-60 and the 137.00 round figure can be witnessed on the USD/JPY chart before finding the buyer’s struggle to overcome the double tops around 137.80-90.
On the flip side, a daily closing below 133.90 may quickly drag the Yen pair to a 133.00 round figure before directing it to April’s low of around 130.63.
In a case where the USD/JPY bears remain dominant past 130.63, the 130.00 round figure and March’s bottom of near 129.65 should pop on their radar.
Trend: Limited upside expected
Technical Levels: Supports and Resistances
USDJPY currently trading at 134.22 at the time of writing. Pair opened at 134.32 and is trading with a change of -0.07% % .
| Overview | Overview.1 | |
|---|---|---|
| 0 | Today last price | 134.22 |
| 1 | Today Daily Change | -0.10 |
| 2 | Today Daily Change % | -0.07% |
| 3 | Today daily open | 134.32 |
The pair is trading below its 20 Daily moving average @ 134.62, above its 50 Daily moving average @ 133.8 , above its 100 Daily moving average @ 132.87 and below its 200 Daily moving average @ 137.02
| Trends | Trends.1 | |
|---|---|---|
| 0 | Daily SMA20 | 134.62 |
| 1 | Daily SMA50 | 133.80 |
| 2 | Daily SMA100 | 132.87 |
| 3 | Daily SMA200 | 137.02 |
The previous day high was 135.47 while the previous day low was 134.11. The daily 38.2% Fib levels comes at 134.63, expected to provide resistance. Similarly, the daily 61.8% fib level is at 134.95, expected to provide resistance.
Note the levels of interest below:
- Pivot support is noted at 133.8, 133.28, 132.44
- Pivot resistance is noted at 135.16, 135.99, 136.51
| Levels | Levels.1 |
|---|---|
| Previous Daily High | 135.47 |
| Previous Daily Low | 134.11 |
| Previous Weekly High | 137.78 |
| Previous Weekly Low | 133.50 |
| Previous Monthly High | 136.56 |
| Previous Monthly Low | 130.63 |
| Daily Fibonacci 38.2% | 134.63 |
| Daily Fibonacci 61.8% | 134.95 |
| Daily Pivot Point S1 | 133.80 |
| Daily Pivot Point S2 | 133.28 |
| Daily Pivot Point S3 | 132.44 |
| Daily Pivot Point R1 | 135.16 |
| Daily Pivot Point R2 | 135.99 |
| Daily Pivot Point R3 | 136.51 |
[/s2If]
Nehcap Expert Advisor
The NEHCAP MT4 EA is high quality professional trading system geared to generate returns without using GRID or martingales. Each trade has strict risk per trade parameter. The pairs under management include EURUSD, GBPUSD, AUDCAD, AUDNZD,GBPAUD, EURAUD, EURCAD, CHFJPY and many more.
The system is trading live: LIVE ACCOUNT TRACKING
You can run it free. Apply for a free trial and track our account. Buy the system or use profit share mechanism to generate returns on your MT4.
Join Our Telegram Group
")


