#XAUUSD @ 2,034.11 Gold Price cheers downbeat United States Consumer Price Index data, softer Treasury bond yields., @nehcap view: Pullback expected (Pivot Orderbook analysis)
…
This is a premium post.
[s2If !current_user_can(access_s2member_level4)]Please register for FREE REGISTER to read full post below containing analysis. In case of any error or you think you are not able to read the full post below, please email us at support#nehcap.com [lwa][/s2If] [s2If current_user_can(access_s2member_level1)]
- Gold Price cheers downbeat United States Consumer Price Index data, softer Treasury bond yields.
- Looming fears of US debt ceiling expiry, hawkish Federal Reserve bets prod XAU/USD buyers.
- More Inflation clues from China, US eyed for clear Gold price directions.
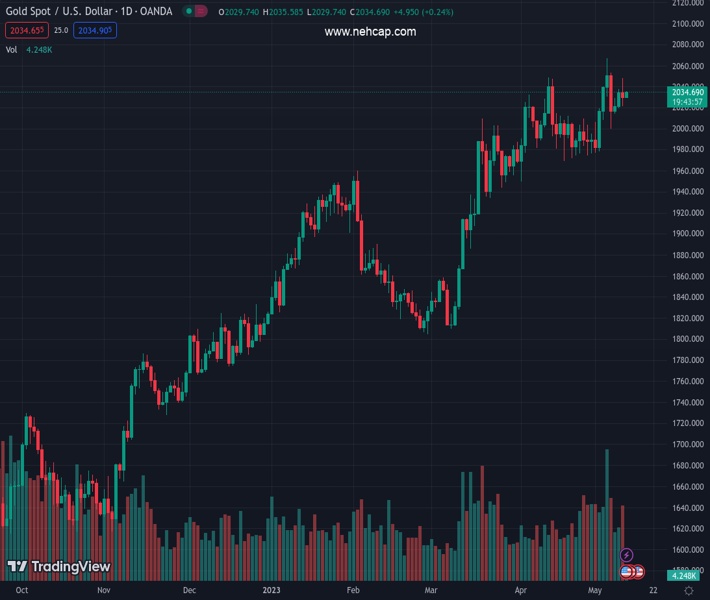
The pair currently trades last at 2034.11.
The previous day high was 2048.27 while the previous day low was 2021.59. The daily 38.2% Fib levels comes at 2031.78, expected to provide support. Similarly, the daily 61.8% fib level is at 2038.08, expected to provide resistance.
Gold price (XAU/USD) picks up bids to refresh intraday high near $2,030 early Thursday, reversing the previous day’s retreat from a one-month-old horizontal resistance. In doing so, the precious metal benefits from the broad US Dollar weakness as the United States inflation data favor a dovish Federal Reserve (Fed) bias. Also weighing on the US Dollar, as well as fueling the XAU/USD price, could be the cautious optimism in the market.
Gold price remains on the way to posting a three-week uptrend amid receding hawkish hopes from the Federal Reserve (Fed), recently backed by the United States’ inflation numbers for April. The US Consumer Price Index (CPI) marked the first fall past 5.0% in two years. The US inflation details, however, weren’t that negative and seemed to have kept the Federal Reserve (Fed) away from the rate cut move until September 2023, per the Fed Fund Futures, which in turn keeps the XAU/USD buyers hopeful.
Talking about the data, the headline CPI eased to 4.9% YoY for April versus market expectations of reprinting 5.0% inflation mark, marking the first below 5.0% print in two years. The MoM figures, however, matched the upbeat 0.4% forecasts compared to 0.1% previous readings. Further, the CPI ex Food & Energy, known as the core CPI, matched 5.5% and 0.4% market consensus on a yearly and monthly basis respectively versus 5.6% and 0.4% priors in that order.
Elsewhere, the US 10-year and two-year Treasury bond yields snapped a four-day winning streak the previous day, also marked the biggest daily loss in a week, as recession woes underpinned the US bond demand. The same, however, failed to underpin the US Dollar amid dovish bias about the Fed and helped the Gold price to remain firmer. That said, the benchmark US bond coupons remain pressured around 3.42% and 3.91% at the latest.
US policymakers failed to seal the debt-ceiling deal in their first attempt on Wednesday but let the ball rolling by allowing office members to discuss the details and try again on Friday, which in turn prod the market sentiment and the Gold buyers. On the same line is the absence of major negatives from the banking front, as well as upbeat earnings and mostly softer US data, which in turn pushed back the bank fears.
Looking forward, the US Producer Price Index (PPI) for April and other second-tier data relating to employment, as well as activities, may entertain the Gold traders. That said, the US PPI for April is expected to ease to 2.4% YoY but the Core PPI may improve to 0.2% on MoM. Hence, the scheduled US inflation clues are also likely to print the mixed details and can keep the US Dollar pressured, as well as allow the XAU/USD buyers to hold the reins. Further, risk catalysts will also be observed for clear directions amid the market’s cautious optimism.
Gold price marches back towards a one-month-old horizontal resistance area surrounding the $2,050. That said, sluggish signals from the Moving Average Convergence and Divergence (MACD) indicator, as well as a steady Relative Strength Index (RSI) line, placed at 14, challenge XAU/USD run-up.
With this, the Gold sellers may remain hopeful of testing the 21-DMA support of around $2,008, a break of which could direct the precious metal toward the $2,000 round figure.
In a case where the XAU/USD remains bearish past $2,000, a seven-week-old ascending support line near $1,986 and the 50-DMA level of around $1,965 will be in the spotlight.
On the flip side, a daily closing beyond the aforementioned horizontal resistance near $2,050 needs validation from an upward-sloping resistance line from early February, near $2,070 by the press time, to refresh the all-time high, currently around $2,080.
Overall, the Gold price may witness a short-term pullback but the overall trend remains bullish until the quote breaks the $1,965 level.
Trend: Pullback expected
Technical Levels: Supports and Resistances
XAUUSD currently trading at 2033.68 at the time of writing. Pair opened at 2029.98 and is trading with a change of 0.18% % .
| Overview | Overview.1 | |
|---|---|---|
| 0 | Today last price | 2033.68 |
| 1 | Today Daily Change | 3.70 |
| 2 | Today Daily Change % | 0.18% |
| 3 | Today daily open | 2029.98 |
The pair remains strongly bullish on the daily timeframe. It trades above its 20 SMA @ 2008.57, 50 SMA 1965.38, 100 SMA @ 1915.76 and 200 SMA @ 1818.6.
| Trends | Trends.1 | |
|---|---|---|
| 0 | Daily SMA20 | 2008.57 |
| 1 | Daily SMA50 | 1965.38 |
| 2 | Daily SMA100 | 1915.76 |
| 3 | Daily SMA200 | 1818.60 |
The previous day high was 2048.27 while the previous day low was 2021.59. The daily 38.2% Fib levels comes at 2031.78, expected to provide support. Similarly, the daily 61.8% fib level is at 2038.08, expected to provide resistance.
Note the levels of interest below:
- Pivot support is noted at 2018.29, 2006.6, 1991.61
- Pivot resistance is noted at 2044.97, 2059.96, 2071.65
| Levels | Levels.1 |
|---|---|
| Previous Daily High | 2048.27 |
| Previous Daily Low | 2021.59 |
| Previous Weekly High | 2079.76 |
| Previous Weekly Low | 1977.12 |
| Previous Monthly High | 2048.75 |
| Previous Monthly Low | 1949.83 |
| Daily Fibonacci 38.2% | 2031.78 |
| Daily Fibonacci 61.8% | 2038.08 |
| Daily Pivot Point S1 | 2018.29 |
| Daily Pivot Point S2 | 2006.60 |
| Daily Pivot Point S3 | 1991.61 |
| Daily Pivot Point R1 | 2044.97 |
| Daily Pivot Point R2 | 2059.96 |
| Daily Pivot Point R3 | 2071.65 |
[/s2If]
Nehcap Expert Advisor
The NEHCAP MT4 EA is high quality professional trading system geared to generate returns without using GRID or martingales. Each trade has strict risk per trade parameter. The pairs under management include EURUSD, GBPUSD, AUDCAD, AUDNZD,GBPAUD, EURAUD, EURCAD, CHFJPY and many more.
The system is trading live: LIVE ACCOUNT TRACKING
You can run it free. Apply for a free trial and track our account. Buy the system or use profit share mechanism to generate returns on your MT4.
Join Our Telegram Group
")


