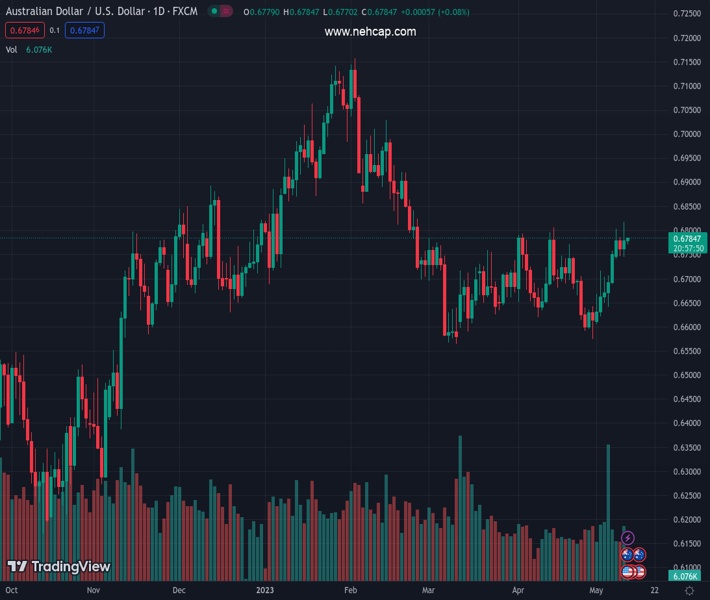
#AUDUSD @ 0.67834 grinds higher after rising to the highest level in 11 weeks. (Pivot Orderbook analysis)
…
This is a premium post.
[s2If !current_user_can(access_s2member_level4)]Please register for FREE REGISTER to read full post below containing analysis. In case of any error or you think you are not able to read the full post below, please email us at support#nehcap.com [lwa][/s2If] [s2If current_user_can(access_s2member_level1)]
- AUD/USD grinds higher after rising to the highest level in 11 weeks.
- Market sentiment remains mildly positive amid softer US inflation, China-linked mixed clues.
- Aussie, China data can entertain intraday traders, risk catalysts are more important for clear directions.
The pair currently trades last at 0.67834.
The previous day high was 0.6787 while the previous day low was 0.6746. The daily 38.2% Fib levels comes at 0.6762, expected to provide support. Similarly, the daily 61.8% fib level is at 0.6771, expected to provide support.
AUD/USD resumes run-up to prod the 0.6800 round figure for the fourth time since early March as markets turn cautiously optimistic after downbeat US inflation and positive vibes from China. However, anxiety ahead of the inflation clues from Australia and China, up for publishing around 01:00 and 01:30 AM GMT, can challenge the Aussie pair buyers during early Thursday.
That said, the US inflation per the Consumer Price Index (CPI) eased to 4.9% YoY for April versus market expectations of reprinting 5.0% inflation mark, marking the first below 5.0% print in two years. The MoM figures, however, matched the upbeat 0.4% forecasts compared to 0.1% previous readings. Further, the CPI ex Food & Energy, known as the core CPI, matched 5.5% and 0.4% market consensus on a yearly and monthly basis respectively versus 5.6% and 0.4% priors in that order.
Following the data, Fed funds futures traders are pricing in a pause before expected rate cuts in September, per Reuters.
Elsewhere, US policymakers failed to seal the debt-ceiling deal in their first attempt but let the ball rolling by allowing office members to discuss the details and try again on Friday, which in turn prod the market sentiment. “Detailed talks on raising the US government’s $31.4 trillion debt ceiling kicked off on Wednesday with Republicans continuing to insist on spending cuts, the day after Democratic President Joe Biden and top congressional Republican Kevin McCarthy’s first meeting in three months,” said Reuters.
On a different page, Australian Treasurer Jim Chalmers was quoted showing readiness to establish more cordial relations with China while praising Australia’s latest annual budget released the previous day.
Alternatively, China military was quoted as rejecting a meeting proposal by the US military officials, which in turn joins the banking woes and fears of debt ceiling expiration weighing on the market sentiment and the AUD/USD prices ahead of the key Aussie-China data.
Against this backdrop, S&P 500 Futures print mild gains after Wall Street’s mixed close whereas US Treasury bond yields struggle for clear directions.
Moving on, AUD/USD traders await Australia’s Consumer Inflation Expectations for May and China’s CPI, as well as the Producer Price Index (PPI), for April ahead of the US PPI for the said month. More importantly, risk catalysts and central bankers, like the Bank of England (BoE) may offer an active day moving forward.
A two-month-old ascending resistance line, around 0.6820 by the press time, restricts the short-term AUD/USD upside. That said, repeated failures to cross the 100-DMA hurdle of around 0.6800 teases the Aussie pair sellers.
Technical Levels: Supports and Resistances
AUDUSD currently trading at 0.6783 at the time of writing. Pair opened at 0.6762 and is trading with a change of 0.31% % .
| Overview | Overview.1 | |
|---|---|---|
| 0 | Today last price | 0.6783 |
| 1 | Today Daily Change | 0.0021 |
| 2 | Today Daily Change % | 0.31% |
| 3 | Today daily open | 0.6762 |
The pair is trading above its 20 Daily moving average @ 0.6693, above its 50 Daily moving average @ 0.6685 , below its 100 Daily moving average @ 0.679 and above its 200 Daily moving average @ 0.6727
| Trends | Trends.1 | |
|---|---|---|
| 0 | Daily SMA20 | 0.6693 |
| 1 | Daily SMA50 | 0.6685 |
| 2 | Daily SMA100 | 0.6790 |
| 3 | Daily SMA200 | 0.6727 |
The previous day high was 0.6787 while the previous day low was 0.6746. The daily 38.2% Fib levels comes at 0.6762, expected to provide support. Similarly, the daily 61.8% fib level is at 0.6771, expected to provide support.
Note the levels of interest below:
- Pivot support is noted at 0.6743, 0.6725, 0.6703
- Pivot resistance is noted at 0.6784, 0.6805, 0.6824
| Levels | Levels.1 |
|---|---|
| Previous Daily High | 0.6787 |
| Previous Daily Low | 0.6746 |
| Previous Weekly High | 0.6757 |
| Previous Weekly Low | 0.6607 |
| Previous Monthly High | 0.6806 |
| Previous Monthly Low | 0.6574 |
| Daily Fibonacci 38.2% | 0.6762 |
| Daily Fibonacci 61.8% | 0.6771 |
| Daily Pivot Point S1 | 0.6743 |
| Daily Pivot Point S2 | 0.6725 |
| Daily Pivot Point S3 | 0.6703 |
| Daily Pivot Point R1 | 0.6784 |
| Daily Pivot Point R2 | 0.6805 |
| Daily Pivot Point R3 | 0.6824 |
[/s2If]
Nehcap Expert Advisor
The NEHCAP MT4 EA is high quality professional trading system geared to generate returns without using GRID or martingales. Each trade has strict risk per trade parameter. The pairs under management include EURUSD, GBPUSD, AUDCAD, AUDNZD,GBPAUD, EURAUD, EURCAD, CHFJPY and many more.
The system is trading live: LIVE ACCOUNT TRACKING
You can run it free. Apply for a free trial and track our account. Buy the system or use profit share mechanism to generate returns on your MT4.
Join Our Telegram Group
")


