#EURJPY @ 147.350 is down 0.45%, influenced by lackluster EUR/USD gains amidst the Japanese Yen strength. (Pivot Orderbook analysis)
…
This is a premium post.
[s2If !current_user_can(access_s2member_level4)]Please register for FREE REGISTER to read full post below containing analysis. In case of any error or you think you are not able to read the full post below, please email us at support#nehcap.com [lwa][/s2If] [s2If current_user_can(access_s2member_level1)]
- EUR/JPY is down 0.45%, influenced by lackluster EUR/USD gains amidst the Japanese Yen strength.
- Technical outlook shows an evening-star pattern, suggesting potential for further downside.
- Key levels to watch: Downside support at 147.04, 145.99, and 145.67; upside resistance at 148.00 and 148.40.
The pair currently trades last at 147.350.
The previous day high was 148.92 while the previous day low was 147.89. The daily 38.2% Fib levels comes at 148.28, expected to provide resistance. Similarly, the daily 61.8% fib level is at 148.52, expected to provide resistance.
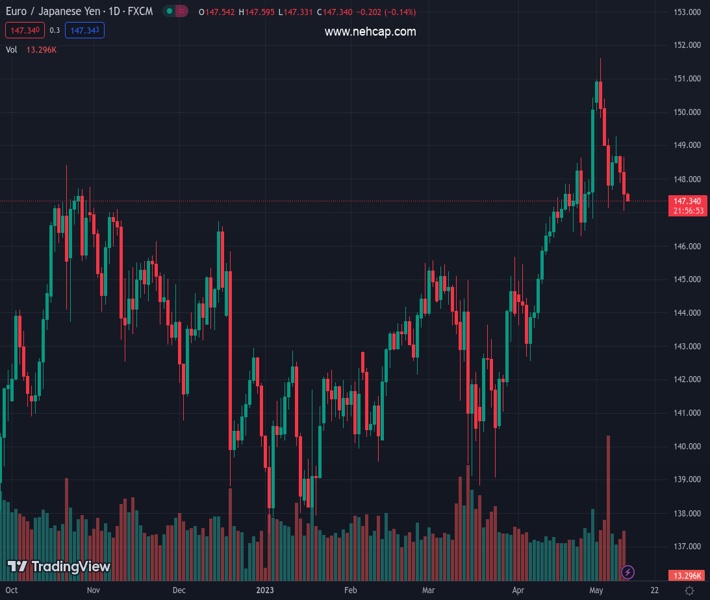
The EUR/JPY weakened on Wednesday by 0.45%, dropped below the 20-day Exponential Moving Average (EMA), influenced by the EUR/USD pair, which finished up, but did not convincingly register solid gains aimed to extend the pair’s rally toward 1.1000. That and the Japanese Yen (JPY) strength were the perfect storms that weighed on the Euro (EUR). Hence, the EUR/JPY is trading at 147.49, down by 0.04% as the Asian session begins.
The EUR/JPY printed back-to-back bearish sessions that cracked last year’s high of 148.40, extending its losses past the 20-day Exponential Moving Average (EMA). An evening-star three-candlestick pattern suggests that further downside is expected. But the Relative Strength Index (RSI) indicator remains bullish, while the 3-day Rate of Change (RoC) depicts sellers gathering momentum.
If EUR/JPY drops below the current week’s low of 147.04 and the RSI pierces the 50-midline, that will exacerbate a decline to the 50-day EMA at 145.99. A decisive break will expose the March 31 high-turned support at 145.67 before retracing to the 100-day EMA at 144.56.
Conversely, if EUR/JPY rallies and claims the 20-day EMA, it could climb above the 148.00 mark. Once cleared, the next stop would be the last year’s high of 148.40, followed by the 150.00 figure.
Technical Levels: Supports and Resistances
EURJPY currently trading at 147.5 at the time of writing. Pair opened at 148.24 and is trading with a change of -0.5 % .
| Overview | Overview.1 | |
|---|---|---|
| 0 | Today last price | 147.50 |
| 1 | Today Daily Change | -0.74 |
| 2 | Today Daily Change % | -0.50 |
| 3 | Today daily open | 148.24 |
The pair is trading below its 20 Daily moving average @ 148.0, above its 50 Daily moving average @ 145.26 , above its 100 Daily moving average @ 143.33 and above its 200 Daily moving average @ 142.88
| Trends | Trends.1 | |
|---|---|---|
| 0 | Daily SMA20 | 148.00 |
| 1 | Daily SMA50 | 145.26 |
| 2 | Daily SMA100 | 143.33 |
| 3 | Daily SMA200 | 142.88 |
The previous day high was 148.92 while the previous day low was 147.89. The daily 38.2% Fib levels comes at 148.28, expected to provide resistance. Similarly, the daily 61.8% fib level is at 148.52, expected to provide resistance.
Note the levels of interest below:
- Pivot support is noted at 147.78, 147.32, 146.75
- Pivot resistance is noted at 148.8, 149.37, 149.83
| Levels | Levels.1 |
|---|---|
| Previous Daily High | 148.92 |
| Previous Daily Low | 147.89 |
| Previous Weekly High | 151.62 |
| Previous Weekly Low | 147.13 |
| Previous Monthly High | 150.44 |
| Previous Monthly Low | 142.55 |
| Daily Fibonacci 38.2% | 148.28 |
| Daily Fibonacci 61.8% | 148.52 |
| Daily Pivot Point S1 | 147.78 |
| Daily Pivot Point S2 | 147.32 |
| Daily Pivot Point S3 | 146.75 |
| Daily Pivot Point R1 | 148.80 |
| Daily Pivot Point R2 | 149.37 |
| Daily Pivot Point R3 | 149.83 |
[/s2If]
Nehcap Expert Advisor
The NEHCAP MT4 EA is high quality professional trading system geared to generate returns without using GRID or martingales. Each trade has strict risk per trade parameter. The pairs under management include EURUSD, GBPUSD, AUDCAD, AUDNZD,GBPAUD, EURAUD, EURCAD, CHFJPY and many more.
The system is trading live: LIVE ACCOUNT TRACKING
You can run it free. Apply for a free trial and track our account. Buy the system or use profit share mechanism to generate returns on your MT4.
Join Our Telegram Group
")


