#GBPJPY @ 169.602 Following the US inflation data release, sinks more than 100 pips to the 169.00 area. (Pivot Orderbook analysis)
…
This is a premium post.
[s2If !current_user_can(access_s2member_level4)]Please register for FREE REGISTER to read full post below containing analysis. In case of any error or you think you are not able to read the full post below, please email us at support#nehcap.com [lwa][/s2If] [s2If current_user_can(access_s2member_level1)]
- Following the US inflation data release, GBP/JPY sinks more than 100 pips to the 169.00 area.
- A bearish technical outlook emerges as RSI aims lower and the 3-day RoC turns negative.
The pair currently trades last at 169.602.
The previous day high was 170.72 while the previous day low was 169.86. The daily 38.2% Fib levels comes at 170.39, expected to provide resistance. Similarly, the daily 61.8% fib level is at 170.19, expected to provide resistance.
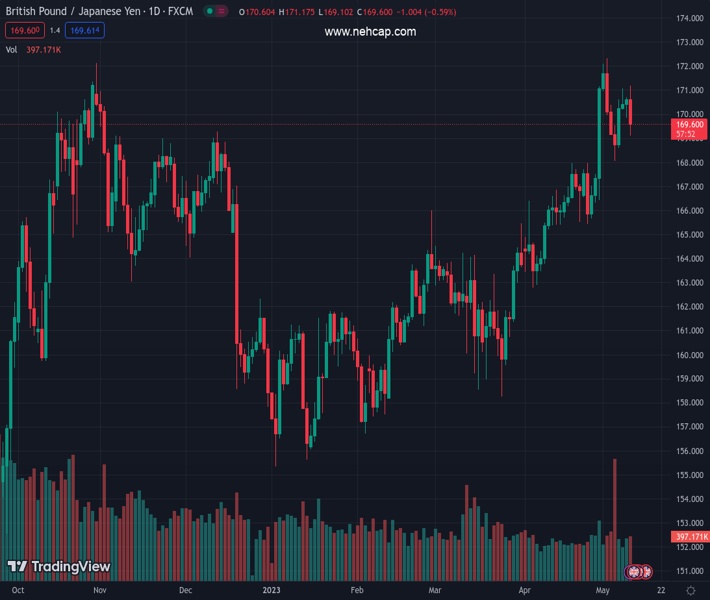
The GBP/JPY slips after hitting a daily high of 171.17 after safe-haven peers advanced following the release of US inflation data. The GBP/JPY slumped more than 100 pips toward the 169.00 handle as traders anticipate another interest rate hike from the Bank of England (BoE) as it scrambles to curb inflation from around 10%.
After snapping three days of gains, the GBP/JPY dropped toward the 169.50 region as the cross-currency pair formed a bearish-engulfing candle pattern. Although the Relative Strength Index (RSI) indicator remains in bullish territory, it continues to aim lower, suggesting buyers are losing steam ahead of the BoE’s decision. The 3-day Rate of Change (RoC) turned negative, allowing sellers to enter new positions.
If GBP/JPY drops below the 169.00 figure, the next support would be the 20-day Exponential Moving Average (EMA) at 168.33, followed by the April 19 high at 167.97. Once cleared, the GBP/JPY next demand area would be the December 20 high turned support at 167.01.
On the flip side, if GBP/JPY reclaimed the 170.00 figure, the next resistance would be May 9 daily high at 170.71. A breach of the latter will expose the May 10 daily high of 171.17, which once cleared, could pave the way to test the YTD high at 172.13.
Technical Levels: Supports and Resistances
GBPJPY currently trading at 169.63 at the time of writing. Pair opened at 170.63 and is trading with a change of -0.59 % .
| Overview | Overview.1 | |
|---|---|---|
| 0 | Today last price | 169.63 |
| 1 | Today Daily Change | -1.00 |
| 2 | Today Daily Change % | -0.59 |
| 3 | Today daily open | 170.63 |
The pair remains strongly bullish on the daily timeframe. It trades above its 20 SMA @ 168.16, 50 SMA 164.95, 100 SMA @ 162.53 and 200 SMA @ 163.6.
| Trends | Trends.1 | |
|---|---|---|
| 0 | Daily SMA20 | 168.16 |
| 1 | Daily SMA50 | 164.95 |
| 2 | Daily SMA100 | 162.53 |
| 3 | Daily SMA200 | 163.60 |
The previous day high was 170.72 while the previous day low was 169.86. The daily 38.2% Fib levels comes at 170.39, expected to provide resistance. Similarly, the daily 61.8% fib level is at 170.19, expected to provide resistance.
Note the levels of interest below:
- Pivot support is noted at 170.09, 169.55, 169.23
- Pivot resistance is noted at 170.94, 171.26, 171.8
| Levels | Levels.1 |
|---|---|
| Previous Daily High | 170.72 |
| Previous Daily Low | 169.86 |
| Previous Weekly High | 172.34 |
| Previous Weekly Low | 168.06 |
| Previous Monthly High | 171.18 |
| Previous Monthly Low | 162.78 |
| Daily Fibonacci 38.2% | 170.39 |
| Daily Fibonacci 61.8% | 170.19 |
| Daily Pivot Point S1 | 170.09 |
| Daily Pivot Point S2 | 169.55 |
| Daily Pivot Point S3 | 169.23 |
| Daily Pivot Point R1 | 170.94 |
| Daily Pivot Point R2 | 171.26 |
| Daily Pivot Point R3 | 171.80 |
[/s2If]
Nehcap Expert Advisor
The NEHCAP MT4 EA is high quality professional trading system geared to generate returns without using GRID or martingales. Each trade has strict risk per trade parameter. The pairs under management include EURUSD, GBPUSD, AUDCAD, AUDNZD,GBPAUD, EURAUD, EURCAD, CHFJPY and many more.
The system is trading live: LIVE ACCOUNT TRACKING
You can run it free. Apply for a free trial and track our account. Buy the system or use profit share mechanism to generate returns on your MT4.
Join Our Telegram Group
")


