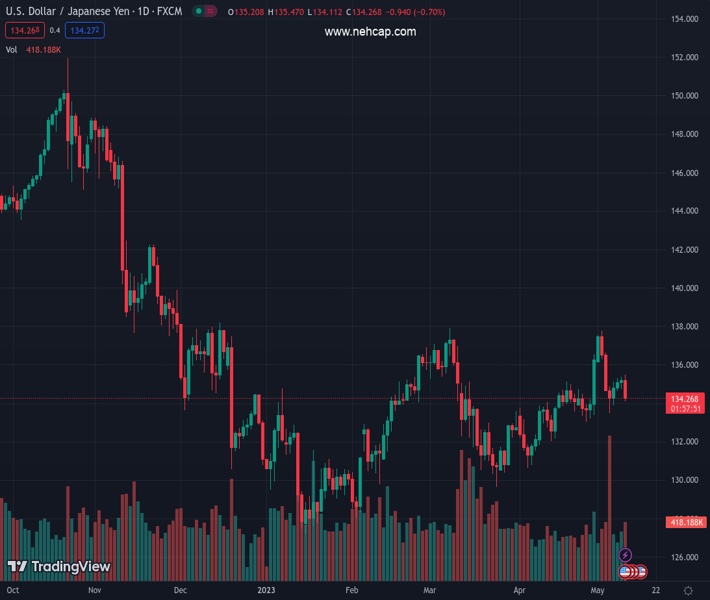
#USDJPY @ 134.266 slides 0.73% after three days of bullish action as US inflation cools down., @nehcap view: Below 135.00, further downside expected. (Pivot Orderbook analysis)
…
This is a premium post.
[s2If !current_user_can(access_s2member_level4)]Please register for FREE REGISTER to read full post below containing analysis. In case of any error or you think you are not able to read the full post below, please email us at support#nehcap.com [lwa][/s2If] [s2If current_user_can(access_s2member_level1)]
- USD/JPY slides 0.73% after three days of bullish action as US inflation cools down.
- The pair drops below key daily moving averages, signaling the potential for further downside.
The pair currently trades last at 134.266.
The previous day high was 135.36 while the previous day low was 134.72. The daily 38.2% Fib levels comes at 135.12, expected to provide resistance. Similarly, the daily 61.8% fib level is at 134.97, expected to provide resistance.
The USD/JPY snaps three days of gains, slides below the 135.00 figure, and distanced from the 20 and 100-day Exponential Moving Average (EMA) at 134.53 and 134.24, respectively, after US inflation cooled down. The fall of the US 10-year Treasury bond yield weighed on the USD/JPY pair due to its close correlation. At the time of writing, the USD/JPY is trading at 134.22, down 0.73%.
Given that the USD/JPY dropped below crucial daily moving averages, the USD/JPY bias shifted neutral. On its way south, the USD/JPY pair fell below dynamic support levels, like the 20 and 100-day EMAs, opening the door to test the 134.00 psychological price level.
If USD/JPY breaks below the latter, the USD/JPY pair would challenge the 50-day EMA at 133.97 before testing the 200-day EMA at 133.87. A breach of the latter will expose the May 4 swing low of 133.49.
Conversely, if USD/JPY reclaims the 20-day EMA at 134.53, the next resistance would be the 135.00 figure, followed by the May 10 high of 135.47. Once cleared, the next demand area would be the May 2 high at 137.77.
Oscillators turned bearish, as the Relative Strength Index (RSI) indicator crossed below the 50-mid line, while the 3-day Rate of Change (RoC) records negative readings.
Trend: Below 135.00, further downside expected.
Technical Levels: Supports and Resistances
USDJPY currently trading at 134.28 at the time of writing. Pair opened at 135.19 and is trading with a change of -0.67 % .
| Overview | Overview.1 | |
|---|---|---|
| 0 | Today last price | 134.28 |
| 1 | Today Daily Change | -0.91 |
| 2 | Today Daily Change % | -0.67 |
| 3 | Today daily open | 135.19 |
The pair is trading below its 20 Daily moving average @ 134.56, above its 50 Daily moving average @ 133.84 , above its 100 Daily moving average @ 132.85 and below its 200 Daily moving average @ 137.02
| Trends | Trends.1 | |
|---|---|---|
| 0 | Daily SMA20 | 134.56 |
| 1 | Daily SMA50 | 133.84 |
| 2 | Daily SMA100 | 132.85 |
| 3 | Daily SMA200 | 137.02 |
The previous day high was 135.36 while the previous day low was 134.72. The daily 38.2% Fib levels comes at 135.12, expected to provide resistance. Similarly, the daily 61.8% fib level is at 134.97, expected to provide resistance.
Note the levels of interest below:
- Pivot support is noted at 134.82, 134.45, 134.18
- Pivot resistance is noted at 135.46, 135.73, 136.1
| Levels | Levels.1 |
|---|---|
| Previous Daily High | 135.36 |
| Previous Daily Low | 134.72 |
| Previous Weekly High | 137.78 |
| Previous Weekly Low | 133.50 |
| Previous Monthly High | 136.56 |
| Previous Monthly Low | 130.63 |
| Daily Fibonacci 38.2% | 135.12 |
| Daily Fibonacci 61.8% | 134.97 |
| Daily Pivot Point S1 | 134.82 |
| Daily Pivot Point S2 | 134.45 |
| Daily Pivot Point S3 | 134.18 |
| Daily Pivot Point R1 | 135.46 |
| Daily Pivot Point R2 | 135.73 |
| Daily Pivot Point R3 | 136.10 |
[/s2If]
Nehcap Expert Advisor
The NEHCAP MT4 EA is high quality professional trading system geared to generate returns without using GRID or martingales. Each trade has strict risk per trade parameter. The pairs under management include EURUSD, GBPUSD, AUDCAD, AUDNZD,GBPAUD, EURAUD, EURCAD, CHFJPY and many more.
The system is trading live: LIVE ACCOUNT TRACKING
You can run it free. Apply for a free trial and track our account. Buy the system or use profit share mechanism to generate returns on your MT4.
Join Our Telegram Group
")


