#USDCAD @ 1.33653 US Dollar regains momentum after selling off following the US CPI. (Pivot Orderbook analysis)
…
This is a premium post.
[s2If !current_user_can(access_s2member_level4)]Please register for FREE REGISTER to read full post below containing analysis. In case of any error or you think you are not able to read the full post below, please email us at support#nehcap.com [lwa][/s2If] [s2If current_user_can(access_s2member_level1)]
- US Dollar regains momentum after selling off following the US CPI.
- Data shows that inflation in the US continued to slow down in April.
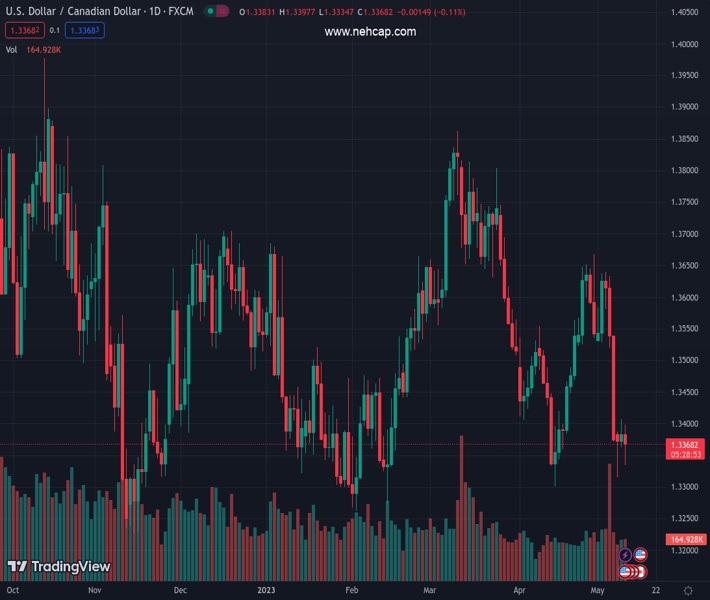
- USD/CAD is back at 1.3380 after hitting two-day lows at 1.3333.
The pair currently trades last at 1.33653.
The previous day high was 1.3406 while the previous day low was 1.3365. The daily 38.2% Fib levels comes at 1.3391, expected to provide resistance. Similarly, the daily 61.8% fib level is at 1.3381, expected to provide resistance.
The USD/CAD dropped to 1.3334 after the release of US inflation data and then bounced sharply, erasing all losses. The pair is hovering around 1.3370, flat for the day.
In April, the Consumer Price Index (CPI) experienced a slight decline to 4.9% from its previous reading of 5% in March. Similarly, the Core rate exhibited a modest deceleration from 5.6% to 5.5%. These figures closely aligned with market expectations. Initially, the release of the US inflation data prompted a decline in the US Dollar Index, that then recovered notably, largely mitigating the post-CPI losses.
On Thursday more US inflation data is due with the Producer Price Index (PPI). Should there be further indications of inflationary pressures easing, the US Dollar could face additional downward pressure.
In Canada, Wednesday’s data release revealed a remarkable surge in Building Permits for March, surpassing expectations of a 2.9% decline with a noteworthy increase of 11.3%; February’s figures were revised from 8.6% to a more modest 5.5%.
The USD/CAD peaked during the European session at 1.3397, but then started to move to the downside. After US data, the pair tumbled driven by the US Dollar’s weakness. Later, it rebounded as the Greenback recovered ground.
Equity prices on Wall Street have receded from their recent highs, with the Dow Jones slipping by 0.39%, while the Nasdaq manages to secure a gain of 0.40%. The US 10-year Treasury yield stands at 3.45%, while the 2-year yield is falling 2% at 3.93%.
If the rebound continues, the USD/CAD will likely encounter resistance at the 1.3400 area. A successful breakthrough above this level would indicate further potential for gains. On the other hand, if it drops below 1.3350, the Loonie will likely strengthen, suggesting a test of the daily low at 1.3333 and then the May low at 1.3312.
Technical Levels: Supports and Resistances
USDCAD currently trading at 1.3367 at the time of writing. Pair opened at 1.3384 and is trading with a change of -0.13 % .
| Overview | Overview.1 | |
|---|---|---|
| 0 | Today last price | 1.3367 |
| 1 | Today Daily Change | -0.0017 |
| 2 | Today Daily Change % | -0.1300 |
| 3 | Today daily open | 1.3384 |
The pair remains strongly bearish on the daily time frame. It trades below the 20 SMA @ 1.3491, 50 SMA 1.3576, 100 SMA @ 1.3518 and 200 SMA @ 1.3452.
| Trends | Trends.1 | |
|---|---|---|
| 0 | Daily SMA20 | 1.3491 |
| 1 | Daily SMA50 | 1.3576 |
| 2 | Daily SMA100 | 1.3518 |
| 3 | Daily SMA200 | 1.3452 |
The previous day high was 1.3406 while the previous day low was 1.3365. The daily 38.2% Fib levels comes at 1.3391, expected to provide resistance. Similarly, the daily 61.8% fib level is at 1.3381, expected to provide resistance.
Note the levels of interest below:
- Pivot support is noted at 1.3364, 1.3344, 1.3323
- Pivot resistance is noted at 1.3405, 1.3426, 1.3446
| Levels | Levels.1 |
|---|---|
| Previous Daily High | 1.3406 |
| Previous Daily Low | 1.3365 |
| Previous Weekly High | 1.3639 |
| Previous Weekly Low | 1.3371 |
| Previous Monthly High | 1.3668 |
| Previous Monthly Low | 1.3301 |
| Daily Fibonacci 38.2% | 1.3391 |
| Daily Fibonacci 61.8% | 1.3381 |
| Daily Pivot Point S1 | 1.3364 |
| Daily Pivot Point S2 | 1.3344 |
| Daily Pivot Point S3 | 1.3323 |
| Daily Pivot Point R1 | 1.3405 |
| Daily Pivot Point R2 | 1.3426 |
| Daily Pivot Point R3 | 1.3446 |
[/s2If]
Nehcap Expert Advisor
The NEHCAP MT4 EA is high quality professional trading system geared to generate returns without using GRID or martingales. Each trade has strict risk per trade parameter. The pairs under management include EURUSD, GBPUSD, AUDCAD, AUDNZD,GBPAUD, EURAUD, EURCAD, CHFJPY and many more.
The system is trading live: LIVE ACCOUNT TRACKING
You can run it free. Apply for a free trial and track our account. Buy the system or use profit share mechanism to generate returns on your MT4.
Join Our Telegram Group
")


