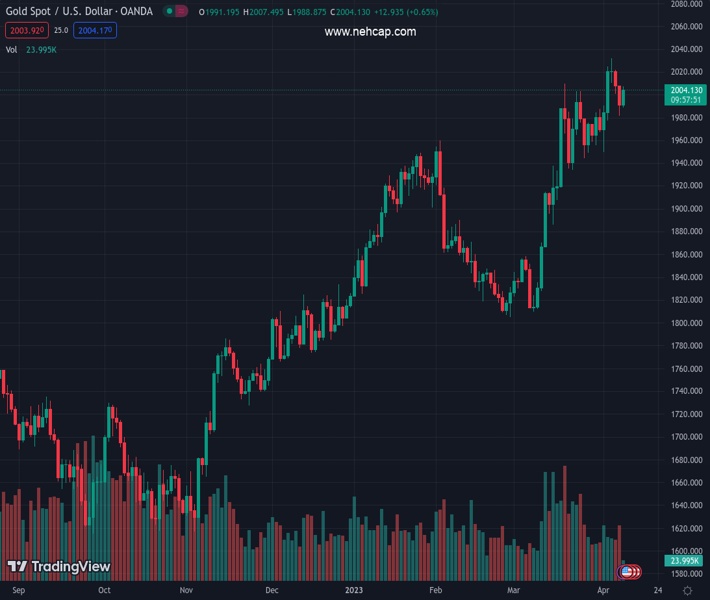
#XAUUSD @ 2,004.13 Gold price regains positive traction on Tuesday amid the emergence of fresh US Dollar selling. (Pivot Orderbook analysis)
…
This is a premium post.
[s2If !current_user_can(access_s2member_level4)]Please register for PREMIUM VERSION HERE to read full post below containing analysis. In case of any error or you think you are not able to read the full post below, please email us at support#nehcap.com [lwa][/s2If] [s2If current_user_can(access_s2member_level4)]
- Gold price regains positive traction on Tuesday amid the emergence of fresh US Dollar selling.
- Bets for more rate hikes by the Federal Reserve could cap any meaningful gains for the metal.
- Traders also seem reluctant ahead of the US CPI report and the FOMC minutes on Wednesday.
The pair currently trades last at 2004.13.
The previous day high was 2006.64 while the previous day low was 1986.28. The daily 38.2% Fib levels comes at 1994.06, expected to provide support. Similarly, the daily 61.8% fib level is at 1998.86, expected to provide support.
Gold price attracts fresh buying on Tuesday and snaps a two-day losing streak to the $1,982-$1,981 region, or a three-day low touched the previous day. The XAU/USD sticks to its intraday gains through the first half of the European session and is currently placed just above the $2,000 psychological mark, near the top end of the daily trading range.
The US Dollar (USD) meets with some supply and stalls a four-day-old recovery trend from over a two-month low touched last week amid some repositioning trade ahead of the latest consumer inflation figures from the United States (US) on Wednesday. This, in turn, is seen as a key factor that benefits the US Dollar-denominated Gold price and remains supportive of the intraday positive move. That said, any meaningful upside seems elusive amid speculations that the Federal Reserve (Fed) may continue raising interest rates.
In fact, the current market pricing indicates a greater chance of another 25 basis points (bps) lift-off at the next Federal Open Market Committee (FOMC) monetary policy meeting in May. The bets were lifted by the mostly upbeat US monthly employment details, popularly known as the Nonfarm Payrolls (NFP) report, released last Friday. This, for now, seems to have put a floor under the US Treasury bond yields, which should act as a tailwind for the Greenback and cap any further gains for the non-yielding Gold price.
Hence, the market focus will remain glued to the FOMC meeting minutes, due on Wednesday, which will be preceded by the release of the crucial US Consumer Price Index (CPI) report on Wednesday. This might influence market expectations about the Fed’s next policy move, which, in turn, will drive the USD demand and provide some meaningful impetus to Gold price. Traders this week will further take cues from the release of the US monthly Retail Sales data on Friday to determine the near-term trajectory for the XAU/USD.
From a technical perspective, any subsequent move up is likely to face stiff resistance near the $2,020 horizontal zone. This is followed by over a one-year high, around the $2,032 area touched last week, which if cleared will be seen as a fresh trigger for bullish traders. Gold price could then accelerate the momentum towards the $2,048-$2,050 intermediate hurdle en route to the all-time high, around the $2,070-$2,075 region.
On the flip side, the $1,990-$1,980 zone now seems to have emerged as an immediate strong support. A convincing break below should pave the way for a slide towards the $1,955-$1,950 region before the Gold price eventually drops to the next relevant support near the $1,935-$1,934 area. The corrective decline could get extended further towards the $1,918-$1,917 horizontal zone en route to the $1,900 round-figure mark.
Technical Levels: Supports and Resistances
XAUUSD currently trading at 2001.83 at the time of writing. Pair opened at 1991.35 and is trading with a change of 0.53 % .
| Overview | Overview.1 | |
|---|---|---|
| 0 | Today last price | 2001.83 |
| 1 | Today Daily Change | 10.48 |
| 2 | Today Daily Change % | 0.53 |
| 3 | Today daily open | 1991.35 |
The pair remains strongly bullish on the daily timeframe. It trades above its 20 SMA @ 1968.77, 50 SMA 1900.12, 100 SMA @ 1864.68 and 200 SMA @ 1788.64.
| Trends | Trends.1 | |
|---|---|---|
| 0 | Daily SMA20 | 1968.77 |
| 1 | Daily SMA50 | 1900.12 |
| 2 | Daily SMA100 | 1864.68 |
| 3 | Daily SMA200 | 1788.64 |
The previous day high was 2006.64 while the previous day low was 1986.28. The daily 38.2% Fib levels comes at 1994.06, expected to provide support. Similarly, the daily 61.8% fib level is at 1998.86, expected to provide support.
Note the levels of interest below:
- Pivot support is noted at 1982.87, 1974.4, 1962.51
- Pivot resistance is noted at 2003.23, 2015.12, 2023.59
| Levels | Levels.1 |
|---|---|
| Previous Daily High | 2006.64 |
| Previous Daily Low | 1986.28 |
| Previous Weekly High | 2032.11 |
| Previous Weekly Low | 1949.83 |
| Previous Monthly High | 2009.88 |
| Previous Monthly Low | 1809.46 |
| Daily Fibonacci 38.2% | 1994.06 |
| Daily Fibonacci 61.8% | 1998.86 |
| Daily Pivot Point S1 | 1982.87 |
| Daily Pivot Point S2 | 1974.40 |
| Daily Pivot Point S3 | 1962.51 |
| Daily Pivot Point R1 | 2003.23 |
| Daily Pivot Point R2 | 2015.12 |
| Daily Pivot Point R3 | 2023.59 |
[/s2If]
Join Our Telegram Group


