#AUDUSD @ 0.67263 takes offers to refresh intraday low during two-day downtrend., @nehcap view: Limited downside expected (Pivot Orderbook analysis)
…
This is a premium post.
[s2If !current_user_can(access_s2member_level4)]Please register for PREMIUM VERSION HERE to read full post below containing analysis. In case of any error or you think you are not able to read the full post below, please email us at support#nehcap.com [lwa][/s2If] [s2If current_user_can(access_s2member_level4)]
- AUD/USD takes offers to refresh intraday low during two-day downtrend.
- 200-EMA prods Aussie pair’s fall inside one-month-old ascending trend channel.
- Impending bear cross on MACD lures sellers but 0.6670 is the key to confirming bearish trend.
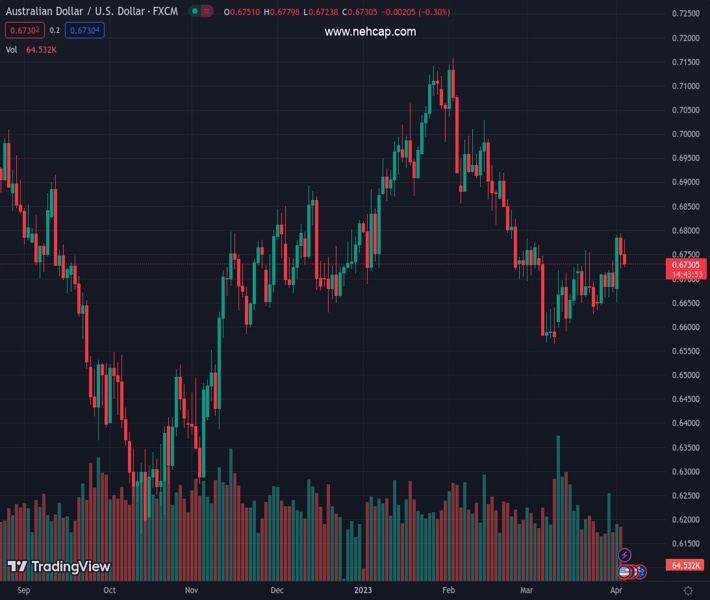
The pair currently trades last at 0.67263.
The previous day high was 0.6793 while the previous day low was 0.6721. The daily 38.2% Fib levels comes at 0.6748, expected to provide resistance. Similarly, the daily 61.8% fib level is at 0.6766, expected to provide resistance.
AUD/USD remains depressed for the second consecutive day, refreshing intraday low near 0.6730 amid the early European session on Wednesday. In doing so, the Aussie pair reveres Reserve Bank of Australia (RBA) Governor Philip Lowe induced corrective bounce while poking the 200-bar Exponential Moving Average (EMA).
It’s worth noting that the quote’s U-turn from the aforementioned channel’s top line joins bearish MACD signals to favor the latest pullback in the AUD/USD price.
As a result, the Aussie bears are well-set to conquer the stated key EMA support of 0.6730 and aim for the 0.6700 round figure.
However, a convergence of the ascending trend channel’s lower line and 23.6% Fibonacci retracement level of the pair’s downturn from mid-February to March 10, around 0.6670, appear a tough nut to crack for the bears.
In a case where the AUD/USD drops below 0.6670, the odds of witnessing a fall towards targeting the YTD low, currently around 0.6565, can’t be ruled out.
On the contrary, recovery moves can aim for the aforementioned channel’s top line and 50% Fibonacci retracement, around 0.6800.
Following that, 0.6810 and 61.8% Fibonacci retracement of 0.6852 may act as intermediate halts during the run-up targeting February’s peak of 0.7030.
Trend: Limited downside expected
Technical Levels: Supports and Resistances
AUDUSD currently trading at 0.6736 at the time of writing. Pair opened at 0.6751 and is trading with a change of -0.22% % .
| Overview | Overview.1 | |
|---|---|---|
| 0 | Today last price | 0.6736 |
| 1 | Today Daily Change | -0.0015 |
| 2 | Today Daily Change % | -0.22% |
| 3 | Today daily open | 0.6751 |
The pair is trading above its 20 Daily moving average @ 0.6673, below its 50 Daily moving average @ 0.6809 , below its 100 Daily moving average @ 0.68 and below its 200 Daily moving average @ 0.675
| Trends | Trends.1 | |
|---|---|---|
| 0 | Daily SMA20 | 0.6673 |
| 1 | Daily SMA50 | 0.6809 |
| 2 | Daily SMA100 | 0.6800 |
| 3 | Daily SMA200 | 0.6750 |
The previous day high was 0.6793 while the previous day low was 0.6721. The daily 38.2% Fib levels comes at 0.6748, expected to provide resistance. Similarly, the daily 61.8% fib level is at 0.6766, expected to provide resistance.
Note the levels of interest below:
- Pivot support is noted at 0.6717, 0.6682, 0.6644
- Pivot resistance is noted at 0.679, 0.6828, 0.6862
| Levels | Levels.1 |
|---|---|
| Previous Daily High | 0.6793 |
| Previous Daily Low | 0.6721 |
| Previous Weekly High | 0.6738 |
| Previous Weekly Low | 0.6634 |
| Previous Monthly High | 0.6784 |
| Previous Monthly Low | 0.6564 |
| Daily Fibonacci 38.2% | 0.6748 |
| Daily Fibonacci 61.8% | 0.6766 |
| Daily Pivot Point S1 | 0.6717 |
| Daily Pivot Point S2 | 0.6682 |
| Daily Pivot Point S3 | 0.6644 |
| Daily Pivot Point R1 | 0.6790 |
| Daily Pivot Point R2 | 0.6828 |
| Daily Pivot Point R3 | 0.6862 |
[/s2If]
Join Our Telegram Group


