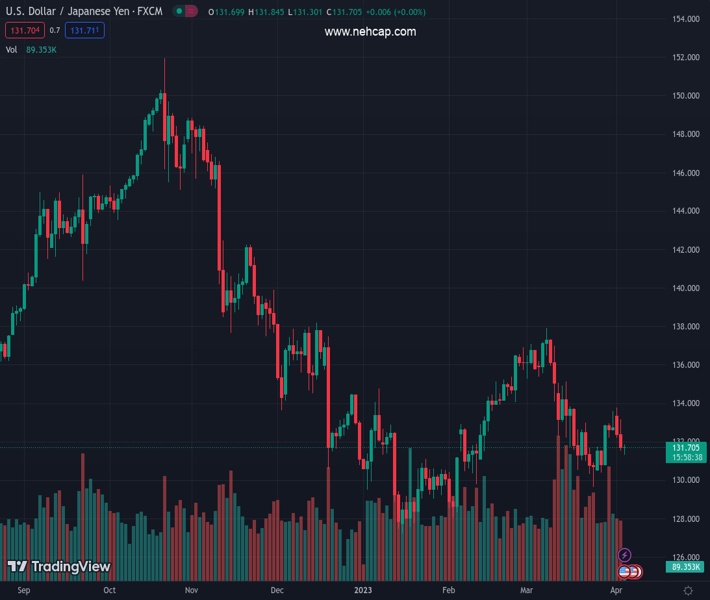
#USDJPY @ 131.694 licks its wounds at one-week low after two-day downtrend. (Pivot Orderbook analysis)
…
This is a premium post.
[s2If !current_user_can(access_s2member_level4)]Please register for PREMIUM VERSION HERE to read full post below containing analysis. In case of any error or you think you are not able to read the full post below, please email us at support#nehcap.com [lwa][/s2If] [s2If current_user_can(access_s2member_level4)]
- USD/JPY licks its wounds at one-week low after two-day downtrend.
- Market sentiment dwindles as traders keenly await key US job, activity numbers following the latest disappointment.
- Treasury bond yields pare recent losses amid sluggish session, mixed data at home.
- Downbeat US data, challenges to USD’s reserve currency status keep Yen sellers hopeful.
The pair currently trades last at 131.694.
The previous day high was 133.17 while the previous day low was 131.52. The daily 38.2% Fib levels comes at 132.15, expected to provide resistance. Similarly, the daily 61.8% fib level is at 132.54, expected to provide resistance.
USD/JPY remains indecisive on a daily basis as it flashes 131.70 as a quote heading into Wednesday’s European session. In doing so, the Yen pair tracks the latest consolidation in the US Treasury bond yields amid cautious markets ahead of the key US Data.
US 10-year and two-year Treasury bond yields take a breather around 3.35% and 3.86% respectively, after falling in the last five and three consecutive days. It’s worth noting that downbeat US employment clues joined previously easing hawkish Fed bias to weigh on the US bond coupons.
That said, US JOLTS Job Openings dropped to the lowest levels since May 2021 while flashing a 9.931M figure for February versus 10.4M expected and 10.563M revised prior. On the same line, US Factory Orders for February came in -0.7% MoM versus -0.5% expected and downwardly revised -2.1% prior.
At home, Japan’s Jibun Bank Manufacturing PMI for March improved to 55.0 versus 54.2.
Also weighing on the US Dollar is Russia’s latest likes for the Chinese Tuan and the China-Brazil pact to ignore the US Dollar as an intermediate currency seems to drag the US Dollar.
However, the recent hawkish comments from Federal Reserve Bank of Cleveland leader Loretta Mester join the cautious mood before the US ISM Services PMI and ADP Employment Change to allow the yields and the US Dollar to stabilize, especially amid off in China.
With this, the US Dollar Index (DXY) dropped to the lowest level in five weeks on Tuesday, before renewing the multi-day bottom and then bouncing off the 101.43 level to around 101.54 by the press time.
Amid these plays, S&P 500 Futures struggle for clear directions near 4,130 but Japan’s Nikkei 225 drops near 1.30% intraday as we write.
Moving on, the downbeat concerns about the Fed’s next move and the US Dollar’s reserve status can weigh on the USD/JPY pair unless the scheduled US data offer a positive surprise and/or market sentiment worsen.
Also read: US ADP Jobs/ISM Service PMI Preview: Slowing but still positive
RSI (14) is below the 50 mark and hence suggests the dip-buying, which in turn highlights an upward-sloping support line from January 16, close to 130.70 at the key level to watch for the USD/JPY bears.
Technical Levels: Supports and Resistances
USDJPY currently trading at 131.71 at the time of writing. Pair opened at 131.7 and is trading with a change of 0.01% % .
| Overview | Overview.1 | |
|---|---|---|
| 0 | Today last price | 131.71 |
| 1 | Today Daily Change | 0.01 |
| 2 | Today Daily Change % | 0.01% |
| 3 | Today daily open | 131.7 |
The pair remains strongly bearish on the daily time frame. It trades below the 20 SMA @ 132.82, 50 SMA 133.01, 100 SMA @ 133.72 and 200 SMA @ 137.28.
| Trends | Trends.1 | |
|---|---|---|
| 0 | Daily SMA20 | 132.82 |
| 1 | Daily SMA50 | 133.01 |
| 2 | Daily SMA100 | 133.72 |
| 3 | Daily SMA200 | 137.28 |
The previous day high was 133.17 while the previous day low was 131.52. The daily 38.2% Fib levels comes at 132.15, expected to provide resistance. Similarly, the daily 61.8% fib level is at 132.54, expected to provide resistance.
Note the levels of interest below:
- Pivot support is noted at 131.09, 130.48, 129.45
- Pivot resistance is noted at 132.74, 133.78, 134.39
| Levels | Levels.1 |
|---|---|
| Previous Daily High | 133.17 |
| Previous Daily Low | 131.52 |
| Previous Weekly High | 133.60 |
| Previous Weekly Low | 130.41 |
| Previous Monthly High | 137.91 |
| Previous Monthly Low | 129.64 |
| Daily Fibonacci 38.2% | 132.15 |
| Daily Fibonacci 61.8% | 132.54 |
| Daily Pivot Point S1 | 131.09 |
| Daily Pivot Point S2 | 130.48 |
| Daily Pivot Point S3 | 129.45 |
| Daily Pivot Point R1 | 132.74 |
| Daily Pivot Point R2 | 133.78 |
| Daily Pivot Point R3 | 134.39 |
[/s2If]
Join Our Telegram Group


