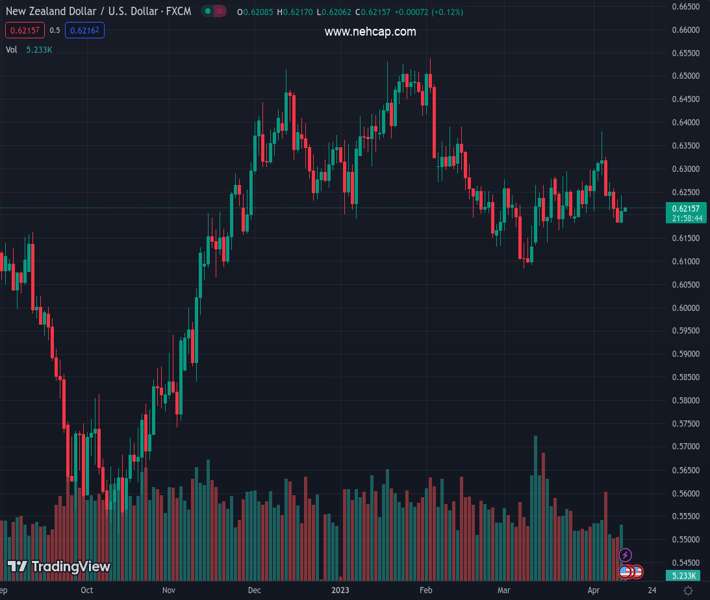
#NZDUSD @ 0.63623 picks up bids to reverse early-day pullback from a seven-week high on RBNZ rate hike. (Pivot Orderbook analysis)
…
This is a premium post.
[s2If !current_user_can(access_s2member_level4)]Please register for PREMIUM VERSION HERE to read full post below containing analysis. In case of any error or you think you are not able to read the full post below, please email us at support#nehcap.com [lwa][/s2If] [s2If current_user_can(access_s2member_level4)]
- NZD/USD picks up bids to reverse early-day pullback from a seven-week high on RBNZ rate hike.
- RBNZ announces 50 bps rate increase to defy market expectations, the 11th in a row.
- Corrective bounce in yields, US Dollar challenge Kiwi pair buyers.
- US ISM Services PMI, ADP Employment Change will be crucial for clear directions amid broad USD weakness.
The pair currently trades last at 0.63623.
The previous day high was 0.6315 while the previous day low was 0.6259. The daily 38.2% Fib levels comes at 0.6294, expected to provide support. Similarly, the daily 61.8% fib level is at 0.6281, expected to provide support.
NZD/USD justifies the Reserve Bank of New Zealand’s (RBNZ) 11th rate hike as it renews the seven-week top following the Interest Rate Decision during early Wednesday, picking up bids to 0.6380 by the press time.
RBNZ surpasses market forecasts while announcing 50 basis points (bps) worth increase to its Official Cash Rate (OCR), lifting it to 5.25% from 4.75% prior.
Also read: Breaking: RBNZ raises rates by 50 bps to 5.25% in April, hawkish surprise
While the hawkish RBNZ moves can be linked to the NZD/USD pair’s latest run-up, the broad-based US Dollar weakness shouldn’t also be missed while citing the bullish catalysts. That said, the US Dollar Index (DXY) dropped to the fresh low since February 02 late Tuesday, keeping the downside bias to renew the multi-day bottom around 101.43 of late, as softer US data joins downbeat fundamentals to weigh on the greenback.
Among the major negatives for the DXY was the US JOLTS Job Openings which dropped to the lowest levels since May 2021 while flashing a 9.931M figure for February versus 10.4M expected and 10.563M revised prior. On the same line, US Factory Orders for February came in -0.7% MoM versus -0.5% expected and downwardly revised -2.1% prior.
It should be noted that the cautious optimism in the market and challenges to the US Dollar’s reserve currency status also contributed to the US Dollar’s weakness even if the Federal Reserve (Fed) policymakers tried to defend hawks.
On Tuesday, Bloomberg released a news report suggesting the US Dollar’s less acceptance as a reserve currency in Russia while highlighting the greenback’s latest weakness. “Chinese Yuan has surpassed the US Dollar as the most traded currency, in monthly trading volume, for the first time in Russia in February,” said the news while also adding that the gap has continued to widen in March. In the last week, Brazil and China agreed to pause the US Dollar’s usage as an intermediary in trade transactions.
On the contrary, hawkish Federal Reserve (Fed) talks challenge the XAU/USD buyers after the previous day’s stellar run-up. Federal Reserve Bank of Cleveland leader Loretta Mester recently cited the need to hike rates above 5% and hold them there for a while.
It’s worth observing that the geopolitical fears emanating from the US-China tension and the EU-Russia tussles also should have prodded the NZD/USD prices but did not mostly downbeat concerns about the US Dollar.
While portraying the market’s mood, the S&P 500 Future print mild gains even as Wall Street closed with minor losses. Further, the US 10-year and two-year Treasury bond yields also take a breather around 3.35% and 3.85% respectively, after falling in the last four and three consecutive days.
Having witnessed the initial reaction to the RBNZ moves, the market’s consolidation may challenge the NZD/USD buyers ahead of the US ISM Services PMI and ADP Employment Change for March.
Given the recently mixed concerns and the hawkish Federal Reserve (Fed) comments, upbeat figures of the scheduled US data can allow the Kiwi pair to consolidate recent gains.
Although a convergence of the 100-DMA and a five-week-old ascending trend line puts a floor under the NZD/USD prices near 0.6300, the Kiwi pair buyers need validation from the 61.8% Fibonacci retracement level of its February-March fall, around 0.6365, to keep the reins.
Technical Levels: Supports and Resistances
NZDUSD currently trading at 0.6308 at the time of writing. Pair opened at 0.6313 and is trading with a change of -0.08% % .
| Overview | Overview.1 | |
|---|---|---|
| 0 | Today last price | 0.6308 |
| 1 | Today Daily Change | -0.0005 |
| 2 | Today Daily Change % | -0.08% |
| 3 | Today daily open | 0.6313 |
The pair remains strongly bullish on the daily timeframe. It trades above its 20 SMA @ 0.6219, 50 SMA 0.6271, 100 SMA @ 0.6298 and 200 SMA @ 0.6159.
| Trends | Trends.1 | |
|---|---|---|
| 0 | Daily SMA20 | 0.6219 |
| 1 | Daily SMA50 | 0.6271 |
| 2 | Daily SMA100 | 0.6298 |
| 3 | Daily SMA200 | 0.6159 |
The previous day high was 0.6315 while the previous day low was 0.6259. The daily 38.2% Fib levels comes at 0.6294, expected to provide support. Similarly, the daily 61.8% fib level is at 0.6281, expected to provide support.
Note the levels of interest below:
- Pivot support is noted at 0.6276, 0.624, 0.6221
- Pivot resistance is noted at 0.6332, 0.6352, 0.6388
| Levels | Levels.1 |
|---|---|
| Previous Daily High | 0.6315 |
| Previous Daily Low | 0.6259 |
| Previous Weekly High | 0.6298 |
| Previous Weekly Low | 0.6180 |
| Previous Monthly High | 0.6298 |
| Previous Monthly Low | 0.6084 |
| Daily Fibonacci 38.2% | 0.6294 |
| Daily Fibonacci 61.8% | 0.6281 |
| Daily Pivot Point S1 | 0.6276 |
| Daily Pivot Point S2 | 0.6240 |
| Daily Pivot Point S3 | 0.6221 |
| Daily Pivot Point R1 | 0.6332 |
| Daily Pivot Point R2 | 0.6352 |
| Daily Pivot Point R3 | 0.6388 |
[/s2If]
Join Our Telegram Group


