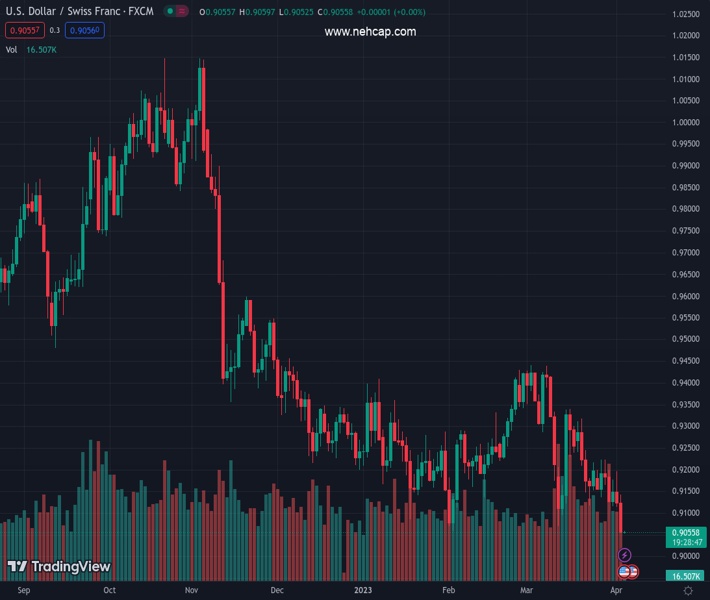
#USDCHF @ 0.90552 holds lower grounds after refreshing multi-day bottom., @nehcap view: Further downside expected (Pivot Orderbook analysis)
…
This is a premium post.
[s2If !current_user_can(access_s2member_level4)]Please register for PREMIUM VERSION HERE to read full post below containing analysis. In case of any error or you think you are not able to read the full post below, please email us at support#nehcap.com [lwa][/s2If] [s2If current_user_can(access_s2member_level4)]
- USD/CHF holds lower grounds after refreshing multi-day bottom.
- Downside break of two-month-old ascending trend line, bearish MACD signals favor sellers.
- Oversold RSI highlights August 2021 low as nearby key support, 61.8% FE lures bears.
- Buyers remain away unless the quote stays below 0.9180.
The pair currently trades last at 0.90552.
The previous day high was 0.9143 while the previous day low was 0.9055. The daily 38.2% Fib levels comes at 0.9089, expected to provide resistance. Similarly, the daily 61.8% fib level is at 0.9109, expected to provide resistance.
USD/CHF bears take a breather at the lowest levels since August 2021, making rounds to 0.9050 during early Wednesday.
The Swiss Franc (CHF) pair refreshed the multi-day low and portrayed a three-day downtrend earlier in Asia while justifying the previous day’s break of the key ascending support line from early February, now immediate resistance near 0.9080.
Adding strength to the downside bias are the bearish MACD signals and the quote’s one-month-old downward trajectory, as indicated by a descending resistance line from early March.
However, the RSI (14) inches close to the oversold territory and hence suggests the dip-buying, which in turn highlights the August 2021 bottom of around 0.9020 and the 0.9000 as the important supports.
Following that, the 61.8% Fibonacci Expansion (FE) of the pair’s moves between November 2022 and March 2023, around 0.8920, will be in focus.
Alternatively, the support-turned-resistance line challenges the USD/CHF pair’s immediate recovery moves around 0.9080, a break which can direct the buyers toward challenging the 10-DMA hurdle of 0.9145.
In a case where the USD/CHF remains firmer past 0.9145, the aforementioned one-month-old resistance line of near 0.9180 can act as the last defense of the bears.
Trend: Further downside expected
Technical Levels: Supports and Resistances
USDCHF currently trading at 0.9055 at the time of writing. Pair opened at 0.9059 and is trading with a change of -0.04% % .
| Overview | Overview.1 | |
|---|---|---|
| 0 | Today last price | 0.9055 |
| 1 | Today Daily Change | -0.0004 |
| 2 | Today Daily Change % | -0.04% |
| 3 | Today daily open | 0.9059 |
The pair remains strongly bearish on the daily time frame. It trades below the 20 SMA @ 0.9208, 50 SMA 0.9245, 100 SMA @ 0.9291 and 200 SMA @ 0.9514.
| Trends | Trends.1 | |
|---|---|---|
| 0 | Daily SMA20 | 0.9208 |
| 1 | Daily SMA50 | 0.9245 |
| 2 | Daily SMA100 | 0.9291 |
| 3 | Daily SMA200 | 0.9514 |
The previous day high was 0.9143 while the previous day low was 0.9055. The daily 38.2% Fib levels comes at 0.9089, expected to provide resistance. Similarly, the daily 61.8% fib level is at 0.9109, expected to provide resistance.
Note the levels of interest below:
- Pivot support is noted at 0.9028, 0.8998, 0.8941
- Pivot resistance is noted at 0.9116, 0.9174, 0.9204
| Levels | Levels.1 |
|---|---|
| Previous Daily High | 0.9143 |
| Previous Daily Low | 0.9055 |
| Previous Weekly High | 0.9224 |
| Previous Weekly Low | 0.9116 |
| Previous Monthly High | 0.9440 |
| Previous Monthly Low | 0.9072 |
| Daily Fibonacci 38.2% | 0.9089 |
| Daily Fibonacci 61.8% | 0.9109 |
| Daily Pivot Point S1 | 0.9028 |
| Daily Pivot Point S2 | 0.8998 |
| Daily Pivot Point S3 | 0.8941 |
| Daily Pivot Point R1 | 0.9116 |
| Daily Pivot Point R2 | 0.9174 |
| Daily Pivot Point R3 | 0.9204 |
[/s2If]
Join Our Telegram Group


