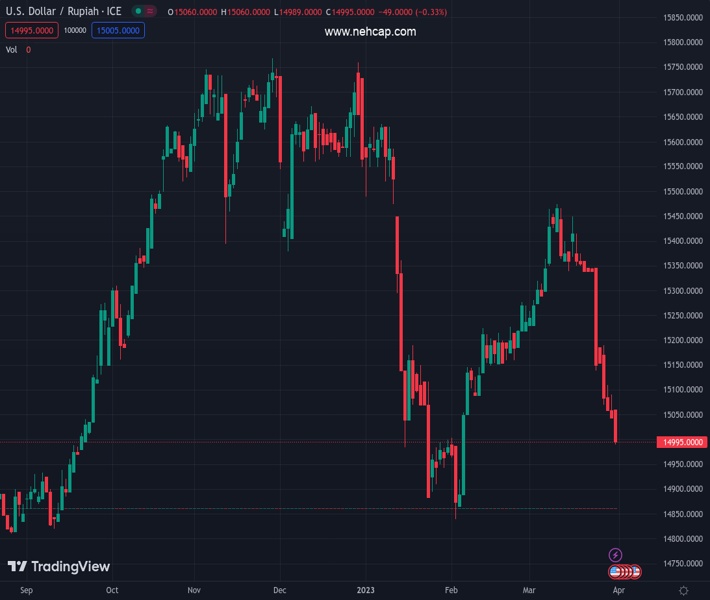
#USDIDR @ 14,996.0 rebounds from the lowest levels since early February, snaps five-day downtrend. (Pivot Orderbook analysis)
…
This is a premium post.
[s2If !current_user_can(access_s2member_level4)]Please register for PREMIUM VERSION HERE to read full post below containing analysis. In case of any error or you think you are not able to read the full post below, please email us at support#nehcap.com [lwa][/s2If] [s2If current_user_can(access_s2member_level4)]
- USD/IDR rebounds from the lowest levels since early February, snaps five-day downtrend.
- Indonesia Inflation eases in March to 4.97% YoY versus 5.17% expected, 5.47% prior.
- US Dollar cheers risk-off mood as the NFP week begins.
- Receding hawkish Fed bets prod pair buyers; focus on US PMIs, jobs report.
The pair currently trades last at 14996.0.
The previous day high was 15062.0 while the previous day low was 14914.75. The daily 38.2% Fib levels comes at 14970.9995, expected to provide support. Similarly, the daily 61.8% fib level is at 15005.7505, expected to provide resistance.
USD/IDR prints the first daily gains in six around the 15,000 mark as softer Indonesia inflation numbers join the US Dollar’s rebound during early Monday. Adding strength to the Indonesia Rupiah (IDR) pair is the broad risk-off mood amid inflation woes, as well as anxiety ahead of Friday’s US employment report for May.
Indonesia Inflation drops to 4.97% YoY in March from 5.47% previous readings and 5.17% market forecasts. Further, the Core Inflation also declined during the stated month, to 2.94% versus 3.05% analysts’ estimations and 3.09% prior. It’s worth noting that the Inflation figures on monthly basis rose to 0.18% from 0.16% marked in February but lagged behind 0.29% consensus.
It’s worth noting that the fresh fears of higher inflation, mainly emanating from a surprise Oil output cut from the Organization of the Petroleum Exporting Countries (OPEC) and its allies led by Russia, known as OPEC+, weigh on market sentiment and propel the USD/IDR pair. The OPEC+ group announced nearly 1.16 million barrels per day output cut in a surprise move during the week. In doing so, the Oil cartel propels fears of more price pressure and hawkish central bank moves. Following the OPEC+ news, the US National Security Council said. “We don’t think cuts are advisable at this moment given market uncertainty – and we’ve made that clear.”
Not only the OPEC+ moves but downbeat China PMI also favor the market’s risk-off mood and allow the US Dollar to the three-week downtrend. That said, China’s Caixin Manufacturing PMI for March drops to 50.0 from 51.6 prior and 51.7 market forecasts.
On the contrary, mixed US data and the Federal Reserve (Fed) policymakers’ inability to convince markets of their hawkish capacity join the easing fears of banking fallouts to exert downside pressure on the USD/IDR pair.
Against this backdrop, the S&P 500 Futures retreat from a 1.5-month high while printing the first daily loss in four, down 0.30% intraday near 4,125 by the press time. On the other hand, the US 10-year and two-year Treasury bond yields print mild gains near 3.52% and 4.11% while paring the latest losses.
Looking forward, US ISM Manufacturing PMI and S&P Global Manufacturing PMI for March can direct intraday moves but major attention should be given to Friday’s US Nonfarm Payrolls (NFP).
A 13-day-old resistance line, around 15,015 by the press time, restricts the immediate upside of the USD/IDR pair, which in turn suggests another attempt to break an eight-month-old support line, close to 14,950 by the press time.
Technical Levels: Supports and Resistances
USDIDR currently trading at 14993 at the time of writing. Pair opened at 14968.65 and is trading with a change of 0.16% % .
| Overview | Overview.1 | |
|---|---|---|
| 0 | Today last price | 14993 |
| 1 | Today Daily Change | 24.3500 |
| 2 | Today Daily Change % | 0.16% |
| 3 | Today daily open | 14968.65 |
The pair remains strongly bearish on the daily time frame. It trades below the 20 SMA @ 15276.5725, 50 SMA 15189.762, 100 SMA @ 15365.3245 and 200 SMA @ 15232.3547.
| Trends | Trends.1 | |
|---|---|---|
| 0 | Daily SMA20 | 15276.5725 |
| 1 | Daily SMA50 | 15189.7620 |
| 2 | Daily SMA100 | 15365.3245 |
| 3 | Daily SMA200 | 15232.3547 |
The previous day high was 15062.0 while the previous day low was 14914.75. The daily 38.2% Fib levels comes at 14970.9995, expected to provide support. Similarly, the daily 61.8% fib level is at 15005.7505, expected to provide resistance.
Note the levels of interest below:
- Pivot support is noted at 14901.6, 14834.55, 14754.35
- Pivot resistance is noted at 15048.85, 15129.05, 15196.1
| Levels | Levels.1 |
|---|---|
| Previous Daily High | 15062.0000 |
| Previous Daily Low | 14914.7500 |
| Previous Weekly High | 15201.0000 |
| Previous Weekly Low | 14914.7500 |
| Previous Monthly High | 15527.1500 |
| Previous Monthly Low | 14914.7500 |
| Daily Fibonacci 38.2% | 14970.9995 |
| Daily Fibonacci 61.8% | 15005.7505 |
| Daily Pivot Point S1 | 14901.6000 |
| Daily Pivot Point S2 | 14834.5500 |
| Daily Pivot Point S3 | 14754.3500 |
| Daily Pivot Point R1 | 15048.8500 |
| Daily Pivot Point R2 | 15129.0500 |
| Daily Pivot Point R3 | 15196.1000 |
[/s2If]
Join Our Telegram Group


