#USDINR @ 82.4175 extends the previous day’s rebound from 10-week-old ascending support line., @nehcap view: Limited upside expected (Pivot Orderbook analysis)
…
This is a premium post.
[s2If !current_user_can(access_s2member_level4)]Please register for PREMIUM VERSION HERE to read full post below containing analysis. In case of any error or you think you are not able to read the full post below, please email us at support#nehcap.com [lwa][/s2If] [s2If current_user_can(access_s2member_level4)]
- USD/INR extends the previous day’s rebound from 10-week-old ascending support line.
- Upside break of 200-SMA, firmer but not overbought RSI favor Indian Rupee sellers.
- Convergence of 13-day-old resistance line, 23.6% Fibonacci retracement challenges USD/INR bulls.
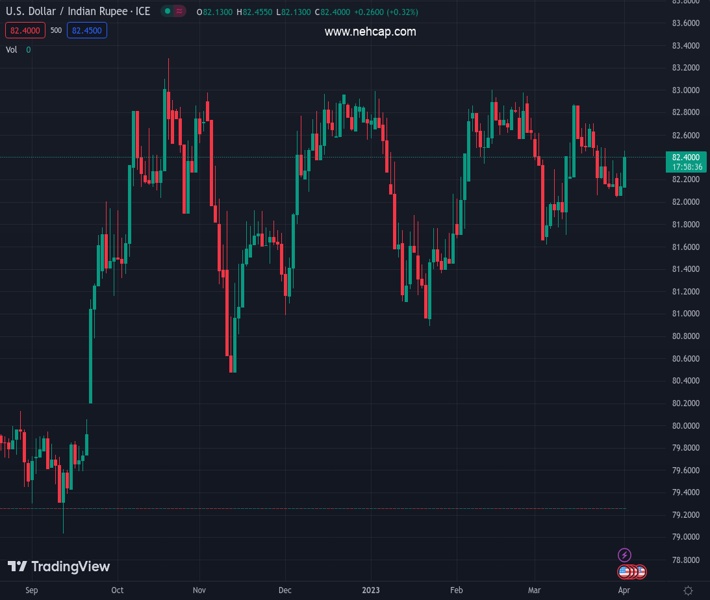
The pair currently trades last at 82.4175.
The previous day high was 82.3122 while the previous day low was 82.034. The daily 38.2% Fib levels comes at 82.2059, expected to provide support. Similarly, the daily 61.8% fib level is at 82.1403, expected to provide support.
USD/INR prints the biggest daily gains in more than two weeks as it rises to 82.45 during early Monday.
In doing so, the Indian Rupee (INR) pair justifies the previous day’s rebound from a 2.5-month-long ascending support line while crossing the 200-bar Simple Moving Average (SMA).
It’s worth noting that the firmer RSI (14) line, not overbought, also underpins the bullish bias about the USD/INR pair.
However, a convergence of the downward-sloping resistance line from mid-March joins the 23.6% Fibonacci retracement level of the pair’s January-February upside to highlight the 82.55 level as a tough nut to crack for the USD/INR bulls.
Should the Indian Rupee pair remains firmer past 82.55 hurdle, a quick run-up toward the 83.00 round figure can’t be ruled out. Though, the yearly high of around 83.10, as well as the record top of 83.42 marked in October 2022, could challenge the pair’s further upside.
Alternatively, pullback moves remain elusive unless the quote offers decisive trading below the 200-bar SMA level surrounding 82.40.
Even so, the USD/INR bears are likely to remain cautious beyond the aforementioned multi-day-old support line, close to 82.10 by the press time.
In a case where the Indian Rupee buyers break the 82.10 support, the odds of witnessing a slump toward the 61.8% Fibonacci retracement level and then toward the previous monthly low, respectively near 81.70 and 81.50, can be expected.
Trend: Limited upside expected
Technical Levels: Supports and Resistances
USDINR currently trading at 82.4309 at the time of writing. Pair opened at 82.1806 and is trading with a change of 0.30% % .
| Overview | Overview.1 | |
|---|---|---|
| 0 | Today last price | 82.4309 |
| 1 | Today Daily Change | 0.2503 |
| 2 | Today Daily Change % | 0.30% |
| 3 | Today daily open | 82.1806 |
The pair remains strongly bullish on the daily timeframe. It trades above its 20 SMA @ 82.2891, 50 SMA 82.3139, 100 SMA @ 82.1764 and 200 SMA @ 81.3183.
| Trends | Trends.1 | |
|---|---|---|
| 0 | Daily SMA20 | 82.2891 |
| 1 | Daily SMA50 | 82.3139 |
| 2 | Daily SMA100 | 82.1764 |
| 3 | Daily SMA200 | 81.3183 |
The previous day high was 82.3122 while the previous day low was 82.034. The daily 38.2% Fib levels comes at 82.2059, expected to provide support. Similarly, the daily 61.8% fib level is at 82.1403, expected to provide support.
Note the levels of interest below:
- Pivot support is noted at 82.0391, 81.8975, 81.7609
- Pivot resistance is noted at 82.3172, 82.4538, 82.5954
| Levels | Levels.1 |
|---|---|
| Previous Daily High | 82.3122 |
| Previous Daily Low | 82.0340 |
| Previous Weekly High | 82.4410 |
| Previous Weekly Low | 82.0300 |
| Previous Monthly High | 83.0315 |
| Previous Monthly Low | 81.5120 |
| Daily Fibonacci 38.2% | 82.2059 |
| Daily Fibonacci 61.8% | 82.1403 |
| Daily Pivot Point S1 | 82.0391 |
| Daily Pivot Point S2 | 81.8975 |
| Daily Pivot Point S3 | 81.7609 |
| Daily Pivot Point R1 | 82.3172 |
| Daily Pivot Point R2 | 82.4538 |
| Daily Pivot Point R3 | 82.5954 |
[/s2If]
Join Our Telegram Group


