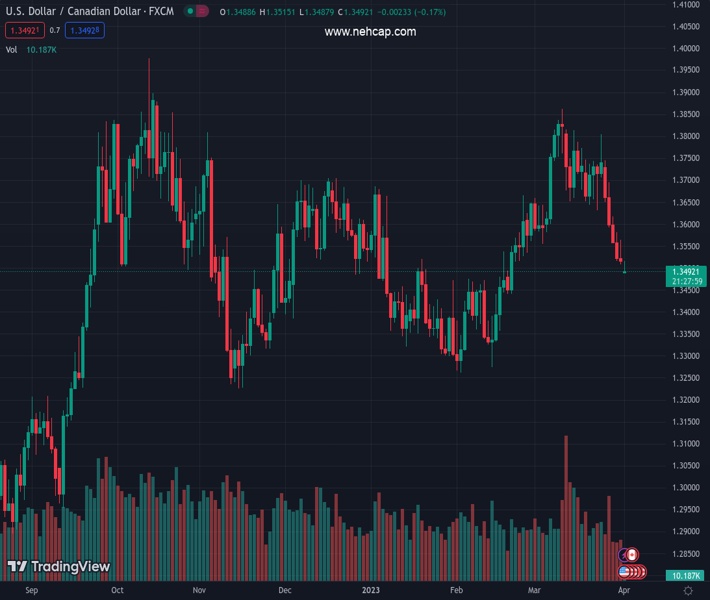
#USDCAD @ 1.35150 has failed to get accepted above 1.3500 as the higher oil price has strengthened the Canadian Dollar. (Pivot Orderbook analysis)
…
This is a premium post.
[s2If !current_user_can(access_s2member_level4)]Please register for PREMIUM VERSION HERE to read full post below containing analysis. In case of any error or you think you are not able to read the full post below, please email us at support#nehcap.com [lwa][/s2If] [s2If current_user_can(access_s2member_level4)]
- USD/CAD has failed to get accepted above 1.3500 as the higher oil price has strengthened the Canadian Dollar.
- The USD Index has scaled above 102.80 as higher oil prices would fuel persistent United States inflation.
- Canada’s upbeat January GDP data has trimmed the chances of reporting an overall quarterly contraction ahead.
The pair currently trades last at 1.35150.
The previous day high was 1.3564 while the previous day low was 1.3508. The daily 38.2% Fib levels comes at 1.3529, expected to provide resistance. Similarly, the daily 61.8% fib level is at 1.3543, expected to provide resistance.
The USD/CAD has retreated from 1.3520 after a rebound attempt followed by a gap-down opening from 1.3488 in the early Tokyo session. The Loonie asset has continued its downside journey as the oil price has soared dramatically after the announcement of a surprise cut in oil production by OPEC+. The oil cartel has decided to cut the oil production further by 1.16 million barrels each day, which has pushed the overall pledge of oil cut to 3.66 million bpd.
It is worth noting that Canada is the leading exporter of oil to the United States and significantly higher oil prices have infused fresh blood into the Canadian Dollar.
The Canadian Dollar remained in action on Friday after the release of upbeat monthly Gross Domestic Product (GDP) (Jan) data. The economic data landed at 0.5%, higher than the estimates of 0.3%. The GDP data was contracted by 0.1% in December and an optimist start of 2023 has trimmed chances of reporting an overall contraction ahead.
Meanwhile, S&P500 futures have recovered some of their losses posted in Asia, portraying recovery in the risk appetite of the market participants. It looks like investors have started digesting the consequences of higher oil prices. The US Dollar Index (DXY) has scaled above 102.80 as higher oil prices would fuel persistent United States inflation.
Going forward, the US ISM Manufacturing PMI data will be keenly watched. According to the consensus, the Manufacturing PMI is expected to decline marginally to 47.5 from the former release of 47.7. Investors should be aware that the US Manufacturing PMI has remained below 50.0 consecutively in the past four months.
From the US Manufacturing PMI gamut, New Orders Index would hog the limelight as it provides cues about the manufacturing outlook. The forward demand for the manufacturing sector is expected to contract significantly to 44.6 vs. the prior release of 47.00.
Technical Levels: Supports and Resistances
USDCAD currently trading at 1.3493 at the time of writing. Pair opened at 1.3519 and is trading with a change of -0.19 % .
| Overview | Overview.1 | |
|---|---|---|
| 0 | Today last price | 1.3493 |
| 1 | Today Daily Change | -0.0026 |
| 2 | Today Daily Change % | -0.1900 |
| 3 | Today daily open | 1.3519 |
The pair is trading below its 20 Daily moving average @ 1.3695, below its 50 Daily moving average @ 1.3543 , below its 100 Daily moving average @ 1.3522 and above its 200 Daily moving average @ 1.3375
| Trends | Trends.1 | |
|---|---|---|
| 0 | Daily SMA20 | 1.3695 |
| 1 | Daily SMA50 | 1.3543 |
| 2 | Daily SMA100 | 1.3522 |
| 3 | Daily SMA200 | 1.3375 |
The previous day high was 1.3564 while the previous day low was 1.3508. The daily 38.2% Fib levels comes at 1.3529, expected to provide resistance. Similarly, the daily 61.8% fib level is at 1.3543, expected to provide resistance.
Note the levels of interest below:
- Pivot support is noted at 1.3496, 1.3474, 1.344
- Pivot resistance is noted at 1.3553, 1.3587, 1.361
| Levels | Levels.1 |
|---|---|
| Previous Daily High | 1.3564 |
| Previous Daily Low | 1.3508 |
| Previous Weekly High | 1.3745 |
| Previous Weekly Low | 1.3508 |
| Previous Monthly High | 1.3862 |
| Previous Monthly Low | 1.3508 |
| Daily Fibonacci 38.2% | 1.3529 |
| Daily Fibonacci 61.8% | 1.3543 |
| Daily Pivot Point S1 | 1.3496 |
| Daily Pivot Point S2 | 1.3474 |
| Daily Pivot Point S3 | 1.3440 |
| Daily Pivot Point R1 | 1.3553 |
| Daily Pivot Point R2 | 1.3587 |
| Daily Pivot Point R3 | 1.3610 |
[/s2If]
Join Our Telegram Group


