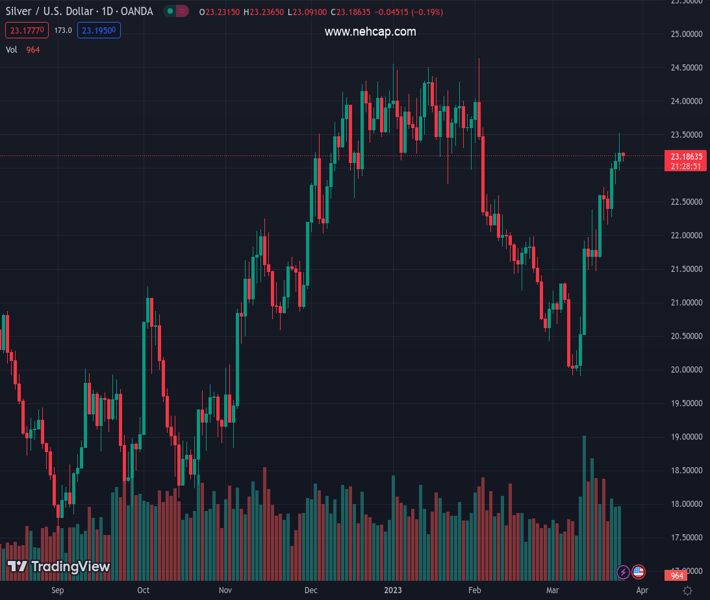
#XAGUSD @ 23.184 Silver price snaps three-day uptrend on breaking a fortnight-old support line., @nehcap view: Pullback expected (Pivot Orderbook analysis)
…
This is a premium post.
[s2If !current_user_can(access_s2member_level4)]Please register for PREMIUM VERSION HERE to read full post below containing analysis. In case of any error or you think you are not able to read the full post below, please email us at support#nehcap.com [lwa][/s2If] [s2If current_user_can(access_s2member_level4)]
- Silver price snaps three-day uptrend on breaking a fortnight-old support line.
- Nearly overbought RSI adds strength to the pullback moves targeting 61.8% Fibonacci retracement.
- Convergence of 50-DMA, 50% Fibonacci retracement acts as an important support, XAG/USD bulls need validation from $23.50.
The pair currently trades last at 23.184.
The previous day high was 23.52 while the previous day low was 22.97. The daily 38.2% Fib levels comes at 23.31, expected to provide resistance. Similarly, the daily 61.8% fib level is at 23.18, expected to provide support.
Silver price (XAG/USD) prints the first daily loss in four as the bright metal drops to $23.15 during early Monday in Asia. In doing so, the bright metal remains depressed after two consecutive weekly losses while justifying Friday’s downside break of a short-term key support line.
Not only a downside break of the two-week-old ascending support line, now resistance near $23.50, but the RSI (14) line’s placement near the oversold territory also teases the XAG/USD sellers.
As a result, the bright metal appears well-set to drop towards the 61.8% Fibonacci retracement level of its February-March downside, near $22.85.
However, the 50% Fibonacci retracement and the 50-DMA, around $22.30-20, could together challenge the Silver bears afterward.
It’s worth noting that the XAG/USD weakness past $22.20 makes it vulnerable to drop toward the early-month swing high of around $23.20 while the 200-DMA support of $21.00 could restrict the commodity’s further downside.
On the flip side, recovery moves remain elusive unless the quote stays beyond the previous support line, now resistance around $23.50.
Following that, multiple hurdles around $24.00 and $24.20 can test the Silver buyers before challenging the yearly high of around $24.65.
Overall, the Silver price flags the risk of further downside but the room towards the south appears limited.
Trend: Pullback expected
Technical Levels: Supports and Resistances
XAGUSD currently trading at 23.19 at the time of writing. Pair opened at 23.24 and is trading with a change of -0.22% % .
| Overview | Overview.1 | |
|---|---|---|
| 0 | Today last price | 23.19 |
| 1 | Today Daily Change | -0.05 |
| 2 | Today Daily Change % | -0.22% |
| 3 | Today daily open | 23.24 |
The pair remains strongly bullish on the daily timeframe. It trades above its 20 SMA @ 21.51, 50 SMA 22.24, 100 SMA @ 22.48 and 200 SMA @ 20.98.
| Trends | Trends.1 | |
|---|---|---|
| 0 | Daily SMA20 | 21.51 |
| 1 | Daily SMA50 | 22.24 |
| 2 | Daily SMA100 | 22.48 |
| 3 | Daily SMA200 | 20.98 |
The previous day high was 23.52 while the previous day low was 22.97. The daily 38.2% Fib levels comes at 23.31, expected to provide resistance. Similarly, the daily 61.8% fib level is at 23.18, expected to provide support.
Note the levels of interest below:
- Pivot support is noted at 22.97, 22.69, 22.41
- Pivot resistance is noted at 23.52, 23.8, 24.08
| Levels | Levels.1 |
|---|---|
| Previous Daily High | 23.52 |
| Previous Daily Low | 22.97 |
| Previous Weekly High | 23.52 |
| Previous Weekly Low | 22.16 |
| Previous Monthly High | 24.64 |
| Previous Monthly Low | 20.42 |
| Daily Fibonacci 38.2% | 23.31 |
| Daily Fibonacci 61.8% | 23.18 |
| Daily Pivot Point S1 | 22.97 |
| Daily Pivot Point S2 | 22.69 |
| Daily Pivot Point S3 | 22.41 |
| Daily Pivot Point R1 | 23.52 |
| Daily Pivot Point R2 | 23.80 |
| Daily Pivot Point R3 | 24.08 |
[/s2If]
Join Our Telegram Group


