The US Dollar Index advances for two days, forming a “morning star” candle chart pattern. (Pivot Orderbook analysis)
…
This is a premium post.
[s2If !current_user_can(access_s2member_level4)]Please register for PREMIUM VERSION HERE to read full post below containing analysis. In case of any error or you think you are not able to read the full post below, please email us at support#nehcap.com [lwa][/s2If] [s2If current_user_can(access_s2member_level4)]
- The US Dollar Index advances for two days, forming a “morning star” candle chart pattern.
- Oscillators paint a mixed picture, though RSI could be turning bullish.
- A daily close above 103.26 will pave the DXY’s way to test 104.00
The pair currently trades last at 103.13.
The previous day high was 102.63 while the previous day low was 101.92. The daily 38.2% Fib levels comes at 102.36, expected to provide support. Similarly, the daily 61.8% fib level is at 102.19, expected to provide support.
The US Dollar Index (DXY), which tracks a basket of six currencies against the US Dollar (USD), advances 1.58% after hitting a 7-week low of 101.91. At the time of writing, the DXY is trading at 103.12 after hitting a daily low of 102.50.
From a daily chart perspective, the DXY is neutrally biased, as it remains above the 2023 low of 100.85. In addition, the US Dollar Index pierced the last higher-high (HH) of 105.63 and printed a YTD high at 105.88. In addition, a candlestick chart pattern, “morning star,” it’s forming, which could pave the way to test the daily Exponential Moving Averages (EMAs) sitting at around 103.782.
For a bullish resumption, the DXY must achieve a daily close above the March 22 high at 103.26. Once done, the DXY could test the confluence of the 20-day EMA and 2017 high at 103.78. If that strong resistance area is broken, the 50-day EMA at 103.97 is up for grabs, ahead of 104.00.
Otherwise, buying weakness could mean that the ongoing leg-up is a correction of a continued downtrend. That said, the US Dollar Index’s first support would be 103.00. A breach of the latter will expose the March 23 swing low at 101.91, followed by the YTD low at 100.85.
Oscillators, like the Relative Strength Index (RSI), are tracking the trend, though it remains bearish. Contrarily, the Rate of Change (RoC) shows that sellers’ momentum is waning, about to turn neutral.
Technical Levels: Supports and Resistances
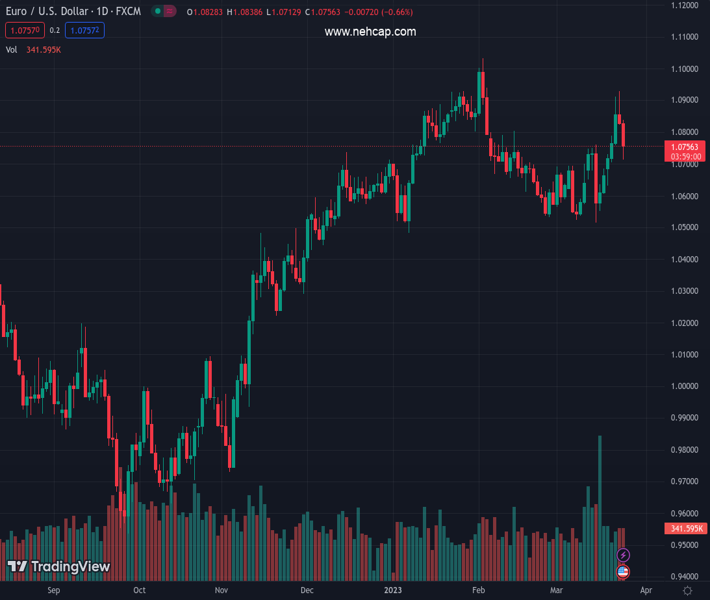
EURUSD currently trading at 103.13 at the time of writing. Pair opened at 102.61 and is trading with a change of 0.51 % .
| Overview | Overview.1 | |
|---|---|---|
| 0 | Today last price | 103.13 |
| 1 | Today Daily Change | 0.52 |
| 2 | Today Daily Change % | 0.51 |
| 3 | Today daily open | 102.61 |
The pair remains strongly bearish on the daily time frame. It trades below the 20 SMA @ 104.31, 50 SMA 103.44, 100 SMA @ 104.22 and 200 SMA @ 106.78.
| Trends | Trends.1 | |
|---|---|---|
| 0 | Daily SMA20 | 104.31 |
| 1 | Daily SMA50 | 103.44 |
| 2 | Daily SMA100 | 104.22 |
| 3 | Daily SMA200 | 106.78 |
The previous day high was 102.63 while the previous day low was 101.92. The daily 38.2% Fib levels comes at 102.36, expected to provide support. Similarly, the daily 61.8% fib level is at 102.19, expected to provide support.
Note the levels of interest below:
- Pivot support is noted at 102.14, 101.67, 101.43
- Pivot resistance is noted at 102.85, 103.1, 103.57
| Levels | Levels.1 |
|---|---|
| Previous Daily High | 102.63 |
| Previous Daily Low | 101.92 |
| Previous Weekly High | 105.11 |
| Previous Weekly Low | 103.44 |
| Previous Monthly High | 105.36 |
| Previous Monthly Low | 100.81 |
| Daily Fibonacci 38.2% | 102.36 |
| Daily Fibonacci 61.8% | 102.19 |
| Daily Pivot Point S1 | 102.14 |
| Daily Pivot Point S2 | 101.67 |
| Daily Pivot Point S3 | 101.43 |
| Daily Pivot Point R1 | 102.85 |
| Daily Pivot Point R2 | 103.10 |
| Daily Pivot Point R3 | 103.57 |
[/s2If]
Join Our Telegram Group


