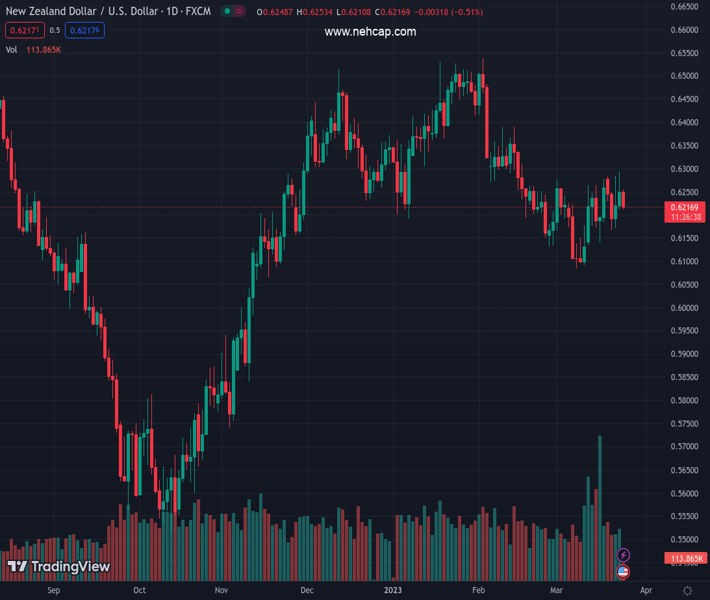
#NZDUSD @ 0.62174 comes under renewed selling pressure on Friday amid the ongoing USD recovery. (Pivot Orderbook analysis)
…
This is a premium post.
[s2If !current_user_can(access_s2member_level4)]Please register for PREMIUM VERSION HERE to read full post below containing analysis. In case of any error or you think you are not able to read the full post below, please email us at support#nehcap.com [lwa][/s2If] [s2If current_user_can(access_s2member_level4)]
- NZD/USD comes under renewed selling pressure on Friday amid the ongoing USD recovery.
- A fresh leg down in the equity markets benefits the buck and weighs on the risk-sensitive Kiwi.
- The Fed’s less hawkish stance, sliding US bond yields could cap any further gains for the USD.
The pair currently trades last at 0.62174.
The previous day high was 0.6295 while the previous day low was 0.6214. The daily 38.2% Fib levels comes at 0.6264, expected to provide resistance. Similarly, the daily 61.8% fib level is at 0.6245, expected to provide resistance.
The NZD/USD pair extends the overnight pullback from the vicinity of the 0.6300 mark, or its highest level since February 16 and witness some follow-through selling on the last day of the week. The downward trajectory picks up pace during the first half of the European session and drags spot prices to a fresh daily low, closer to the 0.6200 round figure in the last hour.
The US Dollar (USD) is gaining positive traction for the second straight day on Friday and recovering further from a seven-week low touched the previous day, which, in turn, is seen weighing on the NZD/USD pair. As investors digest the Federal Reserve’s less hawkish outlook, a fresh leg down in the equity markets drives some haven flow towards the Greenback and exerts pressure on the risk-sensitive Kiwi.
Against the backdrop of worries about a full-blown banking crisis, the disappointing release of the flash German Manufacturing PMI for March revives fears of a deeper global economic downturn. This, in turn, takes its toll on the global risk sentiment and boosts demand for traditional safe-haven assets, including the buck. That said, the Fed’s hints of a pause to interest rate hikes could cap gains for the USD.
It is worth recalling that the US central bank, as was widely anticipated, raised interest rates by 25 bps on Wednesday, though sounded cautious in the wake of the recent turmoil in the banking sector. Furthermore, the Fed lowered its median forecast for real GDP growth projections for 2023 and 2024. This leads to a further decline in the US Treasury bond yields and should act as a headwind for the Greenback.
This, in turn, warrants some caution before positioning for an intraday depreciating move for the NZD/USD pair. Even from a technical perspective, the recent two-way range bound price action witnessed over the past two weeks or so also points to indecision over the next leg of a directional move. That said, repeated failures to find acceptance above the 200-day Simple Moving Average (SMA) favour bearish traders.
Market participants now look forward to the US economic docket, featuring the release of Durable Goods Orders and flash PMI prints later during the early North American session. This, along with the US bond yields, might influence the USD and provide some impetus to the NZD/USD pair. Traders will further take cues from the broader risk sentiment to grab short-term opportunities on the last day of the week.
Technical Levels: Supports and Resistances
NZDUSD currently trading at 0.6215 at the time of writing. Pair opened at 0.625 and is trading with a change of -0.56 % .
| Overview | Overview.1 | |
|---|---|---|
| 0 | Today last price | 0.6215 |
| 1 | Today Daily Change | -0.0035 |
| 2 | Today Daily Change % | -0.5600 |
| 3 | Today daily open | 0.6250 |
The pair is trading above its 20 Daily moving average @ 0.6194, below its 50 Daily moving average @ 0.6301 , below its 100 Daily moving average @ 0.6279 and above its 200 Daily moving average @ 0.6161
| Trends | Trends.1 | |
|---|---|---|
| 0 | Daily SMA20 | 0.6194 |
| 1 | Daily SMA50 | 0.6301 |
| 2 | Daily SMA100 | 0.6279 |
| 3 | Daily SMA200 | 0.6161 |
The previous day high was 0.6295 while the previous day low was 0.6214. The daily 38.2% Fib levels comes at 0.6264, expected to provide resistance. Similarly, the daily 61.8% fib level is at 0.6245, expected to provide resistance.
Note the levels of interest below:
- Pivot support is noted at 0.6211, 0.6171, 0.6129
- Pivot resistance is noted at 0.6292, 0.6334, 0.6374
| Levels | Levels.1 |
|---|---|
| Previous Daily High | 0.6295 |
| Previous Daily Low | 0.6214 |
| Previous Weekly High | 0.6278 |
| Previous Weekly Low | 0.6131 |
| Previous Monthly High | 0.6538 |
| Previous Monthly Low | 0.6131 |
| Daily Fibonacci 38.2% | 0.6264 |
| Daily Fibonacci 61.8% | 0.6245 |
| Daily Pivot Point S1 | 0.6211 |
| Daily Pivot Point S2 | 0.6171 |
| Daily Pivot Point S3 | 0.6129 |
| Daily Pivot Point R1 | 0.6292 |
| Daily Pivot Point R2 | 0.6334 |
| Daily Pivot Point R3 | 0.6374 |
[/s2If]
Join Our Telegram Group


