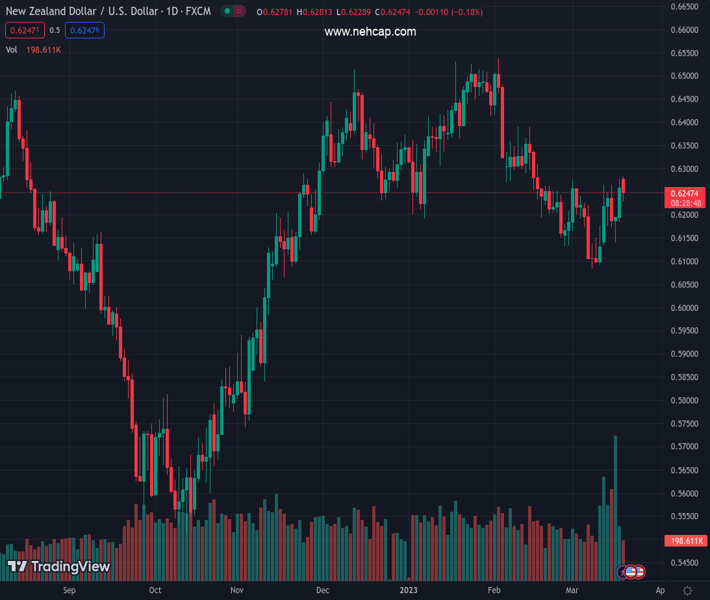
#NZDUSD @ 0.62470 pulls back from over a one-month high set on Monday, though lacks follow-through. (Pivot Orderbook analysis)
…
This is a premium post.
[s2If !current_user_can(access_s2member_level4)]Please register for PREMIUM VERSION HERE to read full post below containing analysis. In case of any error or you think you are not able to read the full post below, please email us at support#nehcap.com [lwa][/s2If] [s2If current_user_can(access_s2member_level4)]
- NZD/USD pulls back from over a one-month high set on Monday, though lacks follow-through.
- The prevalent risk-off environment is seen as a key factor weighing on the risk-sensitive Kiwi.
- The technical setup still favours bullish traders and supports prospects for additional gains.
The pair currently trades last at 0.62470.
The previous day high was 0.6278 while the previous day low was 0.6178. The daily 38.2% Fib levels comes at 0.624, expected to provide support. Similarly, the daily 61.8% fib level is at 0.6216, expected to provide support.
The NZD/USD pair retreats from over a one-month high, around the 0.6280 region touched earlier this Monday and maintains its offered tone heading into the North American session. The pair is currently placed just below mid-0.6200s, down over 0.35% for the day, and continues with its struggle to decisively break through the 0.6260-0.6270 confluence hurdle.
The said barrier comprises the 200-day Exponential Moving Average (EMA) and the 38.2% Fibonacci retracement level of the February-March downfall. Given that oscillators on the daily chart have just started gaining positive traction, a sustained move beyond will be seen as a fresh trigger for bullish traders. This, in turn, will set the stage for an extension of the NZD/USD pair’s recent recovery from the YTD low, around the 0.6085 region touched earlier this month.
The subsequent move-up could then allow spot prices to reclaim the 0.6300 round-figure mark, which coincides with the 50% Fibo. level. The upward trajectory could get extended further and lift the NZD/USD pair towards the 61.8% Fibo. level, around the 0.6360 region, en route to the next relevant hurdle just ahead of the 0.6400 round figure. That said, the prevalent risk-off environment might hold back bulls from placing aggressive bets around the risk-sensitive Kiwi.
On the flip side, any meaningful pullback towards the 0.6200 round-figure mark, or the 23.6% Fibo. level might still be seen as a buying opportunity and is more likely to remain limited, at least for now. That said, a convincing break below might negate the positive outlook and shift the near-term bias back in favour of bearish traders. The NZD/USD pair might then accelerate the fall towards the 0.6135-0.6125 intermediate support before eventually dropping to the 0.6100 mark.
Some follow-through selling below the 0.6085 area, or the YTD low, could make spot prices vulnerable to challenge the 0.6000 psychological mark. The downward trajectory could get extended further towards the 0.5945 support zone en route to the 0.5900 round figure and the next relevant support near the 0.5870-0.5860 region.
Technical Levels: Supports and Resistances
NZDUSD currently trading at 0.6247 at the time of writing. Pair opened at 0.6269 and is trading with a change of -0.35 % .
| Overview | Overview.1 | |
|---|---|---|
| 0 | Today last price | 0.6247 |
| 1 | Today Daily Change | -0.0022 |
| 2 | Today Daily Change % | -0.3500 |
| 3 | Today daily open | 0.6269 |
The pair is trading above its 20 Daily moving average @ 0.6194, below its 50 Daily moving average @ 0.6313 , below its 100 Daily moving average @ 0.6263 and above its 200 Daily moving average @ 0.6162
| Trends | Trends.1 | |
|---|---|---|
| 0 | Daily SMA20 | 0.6194 |
| 1 | Daily SMA50 | 0.6313 |
| 2 | Daily SMA100 | 0.6263 |
| 3 | Daily SMA200 | 0.6162 |
The previous day high was 0.6278 while the previous day low was 0.6178. The daily 38.2% Fib levels comes at 0.624, expected to provide support. Similarly, the daily 61.8% fib level is at 0.6216, expected to provide support.
Note the levels of interest below:
- Pivot support is noted at 0.6205, 0.6141, 0.6105
- Pivot resistance is noted at 0.6305, 0.6342, 0.6406
| Levels | Levels.1 |
|---|---|
| Previous Daily High | 0.6278 |
| Previous Daily Low | 0.6178 |
| Previous Weekly High | 0.6278 |
| Previous Weekly Low | 0.6131 |
| Previous Monthly High | 0.6538 |
| Previous Monthly Low | 0.6131 |
| Daily Fibonacci 38.2% | 0.6240 |
| Daily Fibonacci 61.8% | 0.6216 |
| Daily Pivot Point S1 | 0.6205 |
| Daily Pivot Point S2 | 0.6141 |
| Daily Pivot Point S3 | 0.6105 |
| Daily Pivot Point R1 | 0.6305 |
| Daily Pivot Point R2 | 0.6342 |
| Daily Pivot Point R3 | 0.6406 |
[/s2If]
Join Our Telegram Group
")


