#USDCAD @ 1.37016 extends its consolidative price move for the second straight day on Monday. (Pivot Orderbook analysis)
…
This is a premium post.
[s2If !current_user_can(access_s2member_level4)]Please register for PREMIUM VERSION HERE to read full post below containing analysis. In case of any error or you think you are not able to read the full post below, please email us at support#nehcap.com [lwa][/s2If] [s2If current_user_can(access_s2member_level4)]
- USD/CAD extends its consolidative price move for the second straight day on Monday.
- The ongoing slump in Oil prices undermines the Loonie and lends support to the major.
- A steep fall in the US bond yields, bets for a less hawkish Fed cap the USD and the pair.
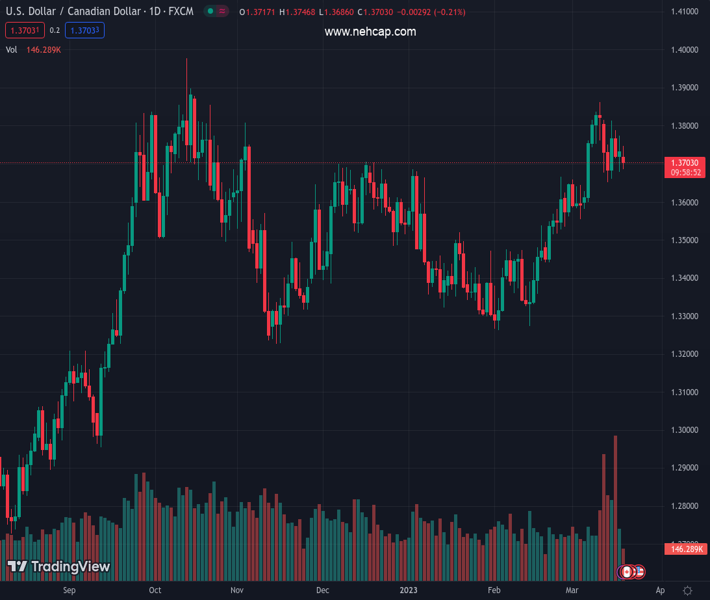
The pair currently trades last at 1.37016.
The previous day high was 1.3773 while the previous day low was 1.3678. The daily 38.2% Fib levels comes at 1.3737, expected to provide resistance. Similarly, the daily 61.8% fib level is at 1.3714, expected to provide resistance.
The USD/CAD pair struggles for a firm direction for the second successive day and seesaws between tepid gains/minor losses through the first half of the European session on Monday. Spot prices, however, manage to hold comfortably above the 1.3700 mark and draw support from a combination of factors.
Crude Oil prices sink to a fresh 15-month low amid worries that a full-blown global banking crisis will cause a recession and hurt fuel demand. This, in turn, is seen weighing on the commodity-linked Loonie and acting as a tailwind for the USD/CAD pair amid a modest US Dollar strength, bolstered by the flight to safety amid the prevalent risk-off environment.
Despite the recent emergency liquidity measures and multi-billion-dollar lifelines for troubled US and European banks, concerns about the contagion risk showed little signs of subsiding. This, along with worries about a deeper global economic downturn, tempers investors’ appetite for riskier assets and benefits traditional safe-haven assets, including the Greenback.
That said, a further steep decline in the US Treasury bond yields is holding back the USD bulls from placing aggressive bets and capping the upside for the USD/CAD pair, at least for the time being. The markets now seem convinced that the Fed will adopt a less aggressive stance and have been pricing in a 25 bps lift-off at its March policy meeting, starting this Tuesday.
The US central bank is also expected to start cutting interest rates during the second half of the year, which led to the recent sharp downfall in the US Treasury bond yields. In fact, the rate-sensitive 2-year US government bond last week recorded its biggest three-day slump since Black Monday in October 1987 and warrants some caution for the USD/CAD bulls.
Traders also seem reluctant and prefer to wait on the sidelines ahead of the outcome of the highly-anticipated FOMC meeting, due to be announced on Wednesday. Heading into the key central bank event risk, traders will take cues from the release of the latest Canadian consumer inflation figures, scheduled for release on Tuesday, for short-term trading impetus.
Technical Levels: Supports and Resistances
USDCAD currently trading at 1.3705 at the time of writing. Pair opened at 1.3729 and is trading with a change of -0.17 % .
| Overview | Overview.1 | |
|---|---|---|
| 0 | Today last price | 1.3705 |
| 1 | Today Daily Change | -0.0024 |
| 2 | Today Daily Change % | -0.1700 |
| 3 | Today daily open | 1.3729 |
The pair remains strongly bullish on the daily timeframe. It trades above its 20 SMA @ 1.3658, 50 SMA 1.3497, 100 SMA @ 1.351 and 200 SMA @ 1.334.
| Trends | Trends.1 | |
|---|---|---|
| 0 | Daily SMA20 | 1.3658 |
| 1 | Daily SMA50 | 1.3497 |
| 2 | Daily SMA100 | 1.3510 |
| 3 | Daily SMA200 | 1.3340 |
The previous day high was 1.3773 while the previous day low was 1.3678. The daily 38.2% Fib levels comes at 1.3737, expected to provide resistance. Similarly, the daily 61.8% fib level is at 1.3714, expected to provide resistance.
Note the levels of interest below:
- Pivot support is noted at 1.368, 1.3631, 1.3585
- Pivot resistance is noted at 1.3776, 1.3822, 1.3872
| Levels | Levels.1 |
|---|---|
| Previous Daily High | 1.3773 |
| Previous Daily Low | 1.3678 |
| Previous Weekly High | 1.3828 |
| Previous Weekly Low | 1.3652 |
| Previous Monthly High | 1.3666 |
| Previous Monthly Low | 1.3262 |
| Daily Fibonacci 38.2% | 1.3737 |
| Daily Fibonacci 61.8% | 1.3714 |
| Daily Pivot Point S1 | 1.3680 |
| Daily Pivot Point S2 | 1.3631 |
| Daily Pivot Point S3 | 1.3585 |
| Daily Pivot Point R1 | 1.3776 |
| Daily Pivot Point R2 | 1.3822 |
| Daily Pivot Point R3 | 1.3872 |
[/s2If]
Join Our Telegram Group
")


