#USDCAD @ 1.37394 Price Analysis: Bulls approach 1.3765 hurdle within weekly triangle, @nehcap view: Further upside expected (Pivot Orderbook analysis)
…
This is a premium post.
[s2If !current_user_can(access_s2member_level4)]Please register for PREMIUM VERSION HERE to read full post below containing analysis. In case of any error or you think you are not able to read the full post below, please email us at support#nehcap.com [lwa][/s2If] [s2If current_user_can(access_s2member_level4)]
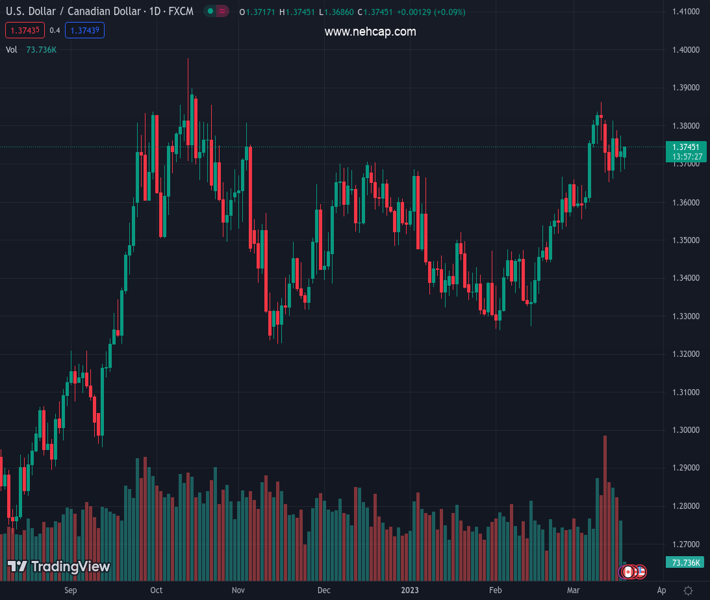
The pair currently trades last at 1.37394.
The previous day high was 1.3773 while the previous day low was 1.3678. The daily 38.2% Fib levels comes at 1.3737, expected to provide support. Similarly, the daily 61.8% fib level is at 1.3714, expected to provide support.
USD/CAD reverses the early Asian session losses as it prints mild gains around 1.3735 during early Monday morning in Europe. In doing so, the Loonie pair defends the previous day’s recovery moves inside a one-week-old symmetrical triangle.
That said, the quote’s latest rebound could be linked to the failure to break the 1.3685 support confluence encompassing the 100-bar Simple Moving Average (SMA) and lower line of the stated triangle.
Adding strength to the recovery moves is the steady RSI (14) and a lack of bearish MACD signals.
As a result, the Loonie pair is all set to poke the 50-SMA hurdle of 1.3750. However, the stated triangle’s top line, close to 1.3765, will be crucial to watch afterward.
Should the quote manage to remain firmer past 1.3765, the monthly high of 1.3861 could act as a buffer before fueling the USD/CAD price towards the previous yearly top of 1.3977 and then to the 1.4000 psychological magnet.
On the flip side, a clear break of the 1.3685 support confluence becomes necessary to convince USD/CAD bears.
Even so, multiple supports near 1.3650, marked during late February and early March, can test the Loonie pair sellers before giving them control.
Following that, a south run towards the 61.8% Fibonacci retracement level of February-March upside, near 1.3490 can’t be ruled out.
Overall, USD/CAD remains on the bull’s radar even if the run-up appears slow.
Trend: Further upside expected
Technical Levels: Supports and Resistances
USDCAD currently trading at 1.3738 at the time of writing. Pair opened at 1.3729 and is trading with a change of 0.07% % .
| Overview | Overview.1 | |
|---|---|---|
| 0 | Today last price | 1.3738 |
| 1 | Today Daily Change | 0.0009 |
| 2 | Today Daily Change % | 0.07% |
| 3 | Today daily open | 1.3729 |
The pair remains strongly bullish on the daily timeframe. It trades above its 20 SMA @ 1.3658, 50 SMA 1.3497, 100 SMA @ 1.351 and 200 SMA @ 1.334.
| Trends | Trends.1 | |
|---|---|---|
| 0 | Daily SMA20 | 1.3658 |
| 1 | Daily SMA50 | 1.3497 |
| 2 | Daily SMA100 | 1.3510 |
| 3 | Daily SMA200 | 1.3340 |
The previous day high was 1.3773 while the previous day low was 1.3678. The daily 38.2% Fib levels comes at 1.3737, expected to provide support. Similarly, the daily 61.8% fib level is at 1.3714, expected to provide support.
Note the levels of interest below:
- Pivot support is noted at 1.368, 1.3631, 1.3585
- Pivot resistance is noted at 1.3776, 1.3822, 1.3872
| Levels | Levels.1 |
|---|---|
| Previous Daily High | 1.3773 |
| Previous Daily Low | 1.3678 |
| Previous Weekly High | 1.3828 |
| Previous Weekly Low | 1.3652 |
| Previous Monthly High | 1.3666 |
| Previous Monthly Low | 1.3262 |
| Daily Fibonacci 38.2% | 1.3737 |
| Daily Fibonacci 61.8% | 1.3714 |
| Daily Pivot Point S1 | 1.3680 |
| Daily Pivot Point S2 | 1.3631 |
| Daily Pivot Point S3 | 1.3585 |
| Daily Pivot Point R1 | 1.3776 |
| Daily Pivot Point R2 | 1.3822 |
| Daily Pivot Point R3 | 1.3872 |
[/s2If]
Join Our Telegram Group
")


