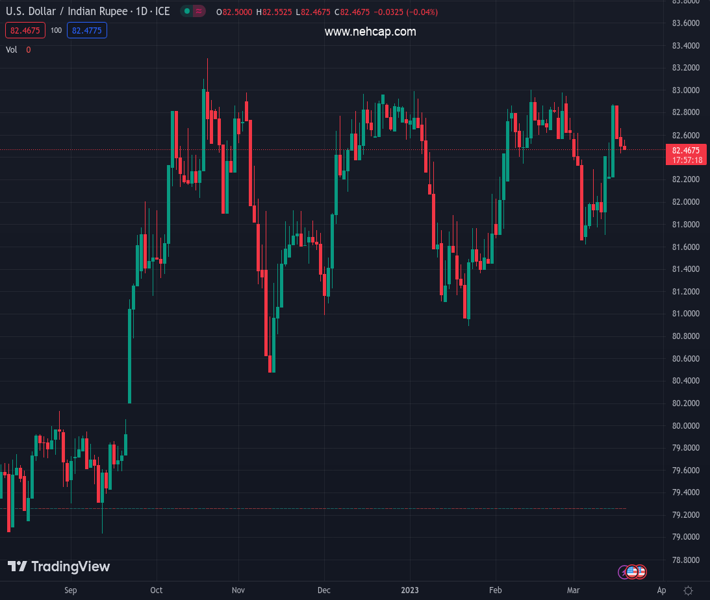
#USDINR @ 82.4750 prints three-day downtrend even as bears struggle to keep the reins of late. (Pivot Orderbook analysis)
…
This is a premium post.
[s2If !current_user_can(access_s2member_level4)]Please register for PREMIUM VERSION HERE to read full post below containing analysis. In case of any error or you think you are not able to read the full post below, please email us at support#nehcap.com [lwa][/s2If] [s2If current_user_can(access_s2member_level4)]
- USD/INR prints three-day downtrend even as bears struggle to keep the reins of late.
- Major central banks’ join effort to tame liquidity crunch, UBS-Credit Suisse deal favor risk-on mood.
- Chatters over the loss of Credit Suisse AT1 bondholders, anxiety ahead of Fed policy meeting probe optimists.
The pair currently trades last at 82.4750.
The previous day high was 82.868 while the previous day low was 82.4195. The daily 38.2% Fib levels comes at 82.5908, expected to provide resistance. Similarly, the daily 61.8% fib level is at 82.6967, expected to provide resistance.
USD/INR remains depressed during a three-day downtrend, mildly offered near 82.50 amid early Monday morning, as the key week begins with baking sector optimism. However, details of the key risk-positive headlines appear fishy and have probed the market’s risk-on mood, which in turn keeps the Indian Rupee (INR) pair sellers hopeful.
Earlier in the day, news surrounding the major central banks’ coordinated efforts to fuel market’s liquidity joined the headlines suggesting the UBS takeover of the troubled Credit Suisse to underpin the recovery in the sentiment.
The same favored the US Treasury bond yields to rebound after the two-year yields dropped the most since 2020 in the last week.
However, headlines from Bank of Japan (BoJ) suggesting it had no bids for US Dollar liquidity infusion joined the news signaling losses of the Credit Suisse AT1 bond holders probe the risk profile and the yields of late. With this, the market sentiment remains mildly bid but the US Dollar struggles to defend the latest gains while Asian currencies are paring the intraday losses.
Elsewhere, downbeat prices of WTI crude oil also weigh on the USD/INR pair due to India’s reliance on the Oil imports and record Currency Account Deficit. That said, the black gold seesaws around the lowest levels since December 2021, marked the previous day.
Amid these plays, the S&P 500 Futures print mild gains while struggling to reverse the previous day’s pullback from a one-week high around 3,970 whereas the US benchmark Treasury bond yields pause the previous week’s fall. That said, the US 10-year Treasury bond yields rise two basis points (bps) to 3.49% while the two-year counterpart also adds three bps to print a 3.93% coupon at the latest.
Moving on, banking sector updates will be crucial for the USD/INR pair traders to watch for clear directions. Also important will be Wednesday’s Federal Open Market Committee (FOMC) monetary policy meeting announcement, as well as the preliminary readings of the March month PMIs.
Although a five-month-old descending resistance line challenges USD/INR bulls around 82.85, the bears have limited downside to track as a convergence of the 100-DMA and 50-DMA puts a floor under the prices near 82.15-10.
Technical Levels: Supports and Resistances
USDINR currently trading at 82.49 at the time of writing. Pair opened at 82.535 and is trading with a change of -0.05% % .
| Overview | Overview.1 | |
|---|---|---|
| 0 | Today last price | 82.49 |
| 1 | Today Daily Change | -0.0450 |
| 2 | Today Daily Change % | -0.05% |
| 3 | Today daily open | 82.535 |
The pair remains strongly bullish on the daily timeframe. It trades above its 20 SMA @ 82.4104, 50 SMA 82.1396, 100 SMA @ 82.1306 and 200 SMA @ 81.1051.
| Trends | Trends.1 | |
|---|---|---|
| 0 | Daily SMA20 | 82.4104 |
| 1 | Daily SMA50 | 82.1396 |
| 2 | Daily SMA100 | 82.1306 |
| 3 | Daily SMA200 | 81.1051 |
The previous day high was 82.868 while the previous day low was 82.4195. The daily 38.2% Fib levels comes at 82.5908, expected to provide resistance. Similarly, the daily 61.8% fib level is at 82.6967, expected to provide resistance.
Note the levels of interest below:
- Pivot support is noted at 82.347, 82.159, 81.8984
- Pivot resistance is noted at 82.7955, 83.056, 83.244
| Levels | Levels.1 |
|---|---|
| Previous Daily High | 82.8680 |
| Previous Daily Low | 82.4195 |
| Previous Weekly High | 83.0315 |
| Previous Weekly Low | 81.5120 |
| Previous Monthly High | 83.0820 |
| Previous Monthly Low | 81.5032 |
| Daily Fibonacci 38.2% | 82.5908 |
| Daily Fibonacci 61.8% | 82.6967 |
| Daily Pivot Point S1 | 82.3470 |
| Daily Pivot Point S2 | 82.1590 |
| Daily Pivot Point S3 | 81.8984 |
| Daily Pivot Point R1 | 82.7955 |
| Daily Pivot Point R2 | 83.0560 |
| Daily Pivot Point R3 | 83.2440 |
[/s2If]
Join Our Telegram Group
")


