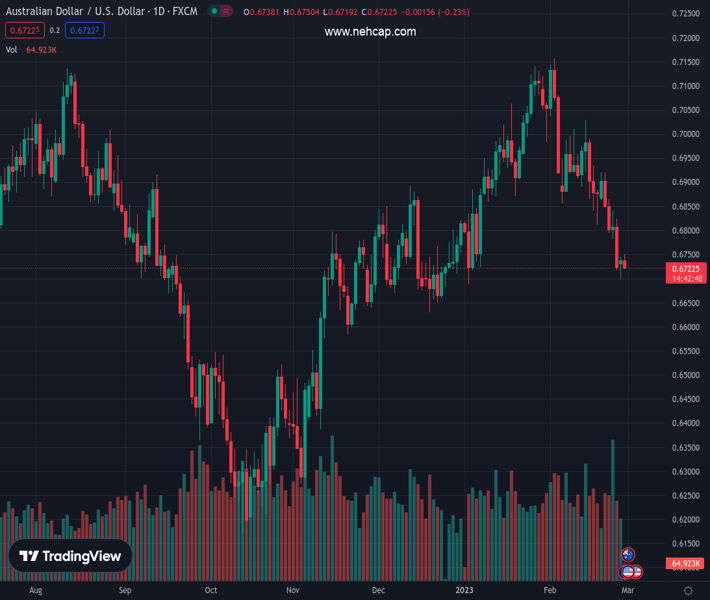
#AUDUSD @ 0.67226 struggles to capitalize on its modest uptick amid renewed USD buying. (Pivot Orderbook analysis)
…
This is a premium post.
[s2If !current_user_can(access_s2member_level4)]Please register for PREMIUM VERSION HERE to read full post below containing analysis. In case of any error or you think you are not able to read the full post below, please email us at support#nehcap.com [lwa][/s2If] [s2If current_user_can(access_s2member_level4)]
- AUD/USD struggles to capitalize on its modest uptick amid renewed USD buying.
- Hawkish Fed expectations, elevated US bond yields help revive the USD demand.
- Recession fears offset the upbeat Australian Retail Sales and act as a headwind.
The pair currently trades last at 0.67226.
The previous day high was 0.6745 while the previous day low was 0.6698. The daily 38.2% Fib levels comes at 0.6727, expected to provide resistance. Similarly, the daily 61.8% fib level is at 0.6716, expected to provide support.
The AUD/USD pair attracts some sellers following an uptick to mid-0.6700s and stalls a modest recovery from its lowest level since January touched the previous day. The pair retreats to the lower end of its daily range, around the 0.6730-0.6725 region during the early European session and is pressured by reviving US Dollar demand.
The prospects for further policy tightening by the Fed remain supportive of elevated US Treasury bond yields and continue to act as a tailwind for the USD. In fact, the markets seem convinced that the US central bank will stick to its hawkish stance for longer in the wake of stubbornly high inflation. The bets were reaffirmed by the stronger US PCE Price Index released last Friday, which indicated that inflation isn’t coming down quite as fast as hoped.
Market participants, meanwhile, remain worried about economic headwinds stemming from rapidly rising borrowing costs. Apart from this, geopolitical tensions keep a lid on the overnight optimistic move in the equity markets, which further benefits the safe-have Greenback and contributes to capping the upside for the risk-sensitive Aussie. This overshadows better-than-expected Australian Retail Sales and does little to lend any support to the AUD/USD pair.
In fact, the Australian Bureau of Statistics reported that Retail Sales grew by 1.9% in January against consensus estimates for a 1.5% rise and the 3.9% downfall recorded in the previous month. The AUD/USD pair’s inability to gain any meaningful traction in reaction to the upbeat domestic data suggests that the downtrend witnessed since the beginning of this month is still far from being over. Bears, however, might wait for a sustained break below the 0.6700 mark.
Traders now look to the US economic docket – featuring the release of regional manufacturing PMI and the Conference Board’s Consumer Confidence Index. This, along with the US bond yields and the broader risk sentiment, might influence the USD price dynamics and provide some impetus to the AUD/USD pair later during the early North American session. Nevertheless, the fundamental backdrop suggests that the path of least resistance for spot prices is to the downside.
Technical Levels: Supports and Resistances
AUDUSD currently trading at 0.6729 at the time of writing. Pair opened at 0.6739 and is trading with a change of -0.15 % .
| Overview | Overview.1 | |
|---|---|---|
| 0 | Today last price | 0.6729 |
| 1 | Today Daily Change | -0.0010 |
| 2 | Today Daily Change % | -0.1500 |
| 3 | Today daily open | 0.6739 |
The pair remains strongly bearish on the daily time frame. It trades below the 20 SMA @ 0.6914, 50 SMA 0.6894, 100 SMA @ 0.673 and 200 SMA @ 0.6799.
| Trends | Trends.1 | |
|---|---|---|
| 0 | Daily SMA20 | 0.6914 |
| 1 | Daily SMA50 | 0.6894 |
| 2 | Daily SMA100 | 0.6730 |
| 3 | Daily SMA200 | 0.6799 |
The previous day high was 0.6745 while the previous day low was 0.6698. The daily 38.2% Fib levels comes at 0.6727, expected to provide resistance. Similarly, the daily 61.8% fib level is at 0.6716, expected to provide support.
Note the levels of interest below:
- Pivot support is noted at 0.671, 0.6681, 0.6663
- Pivot resistance is noted at 0.6757, 0.6774, 0.6803
| Levels | Levels.1 |
|---|---|
| Previous Daily High | 0.6745 |
| Previous Daily Low | 0.6698 |
| Previous Weekly High | 0.6921 |
| Previous Weekly Low | 0.6719 |
| Previous Monthly High | 0.7143 |
| Previous Monthly Low | 0.6688 |
| Daily Fibonacci 38.2% | 0.6727 |
| Daily Fibonacci 61.8% | 0.6716 |
| Daily Pivot Point S1 | 0.6710 |
| Daily Pivot Point S2 | 0.6681 |
| Daily Pivot Point S3 | 0.6663 |
| Daily Pivot Point R1 | 0.6757 |
| Daily Pivot Point R2 | 0.6774 |
| Daily Pivot Point R3 | 0.6803 |
[/s2If]
Join Our Telegram Group


