#USDJPY @ 136.306 remains sidelined, fails to extend week-start pullback from two-month high., @nehcap view: Limited upside expected (Pivot Orderbook analysis)
…
This is a premium post.
[s2If !current_user_can(access_s2member_level4)]Please register for PREMIUM VERSION HERE to read full post below containing analysis. In case of any error or you think you are not able to read the full post below, please email us at support#nehcap.com [lwa][/s2If] [s2If current_user_can(access_s2member_level4)]
- USD/JPY remains sidelined, fails to extend week-start pullback from two-month high.
- Impending bear cross on MACD, bearish chart formation challenges Yen pair buyers.
- 50-SMA adds strength to the 135.00 support holding the door for sellers.
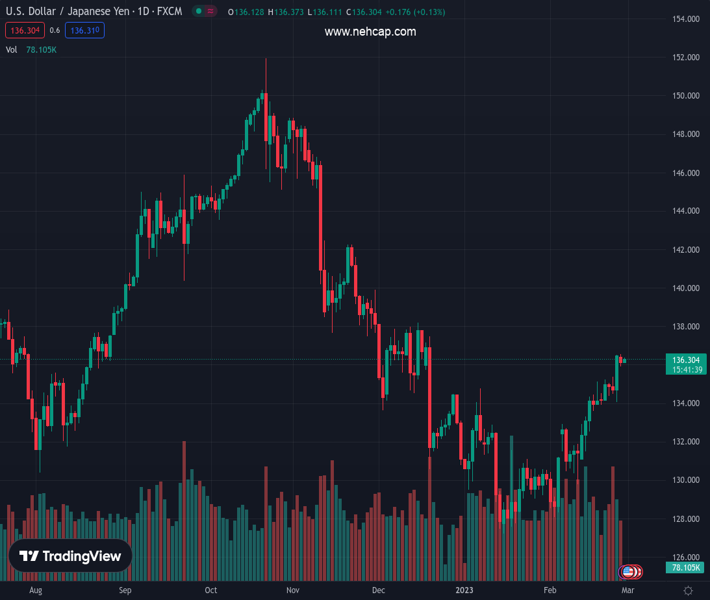
The pair currently trades last at 136.306.
The previous day high was 136.56 while the previous day low was 135.92. The daily 38.2% Fib levels comes at 136.16, expected to provide support. Similarly, the daily 61.8% fib level is at 136.31, expected to provide resistance.
USD/JPY seesaws near 136.30-40 during the initial hours of Tuesday’s European session. In doing so, the Yen pair fails to extend the previous day’s U-turn from the two-month high while staying inside a three-week-old rising wedge bearish chart pattern.
In addition to the rising wedge and lackluster moves, the impending bear cross on the MACD also keeps USD/JPY sellers hopeful unless the quote defies the bearish chart pattern. For that, the Yen pair needs to remain successfully beyond the 136.90 immediate hurdle, as well as cross the 137.00 round figure.
It’s worth observing that the mid-December 2022 high near 138.20 acts as the last defense of the USD/JPY bears, a break of which could quickly propel the prices towards the 140.00 psychological magnet.
Meanwhile, a convergence of the 50-SMA and the aforementioned wedge’s bottom line highlights the 135.00 round figure as the short-term key support.
Should the USD/JPY bears keep the reins below the 135.00 support confluence, the early month high near 133.00 may probe sellers during the theoretical south run targeting the monthly low of near 128.00.
Overall, USD/JPY bulls seem to run out of steam after posting the biggest monthly jump in four months. Though, bears are far from entry unless the quote stays beyond 135.00.
Trend: Limited upside expected
Technical Levels: Supports and Resistances
USDJPY currently trading at 136.31 at the time of writing. Pair opened at 136.26 and is trading with a change of 0.04% % .
| Overview | Overview.1 | |
|---|---|---|
| 0 | Today last price | 136.31 |
| 1 | Today Daily Change | 0.05 |
| 2 | Today Daily Change % | 0.04% |
| 3 | Today daily open | 136.26 |
The pair is trading above its 20 Daily moving average @ 132.8, above its 50 Daily moving average @ 131.77 , below its 100 Daily moving average @ 137.07 and below its 200 Daily moving average @ 137.13
| Trends | Trends.1 | |
|---|---|---|
| 0 | Daily SMA20 | 132.80 |
| 1 | Daily SMA50 | 131.77 |
| 2 | Daily SMA100 | 137.07 |
| 3 | Daily SMA200 | 137.13 |
The previous day high was 136.56 while the previous day low was 135.92. The daily 38.2% Fib levels comes at 136.16, expected to provide support. Similarly, the daily 61.8% fib level is at 136.31, expected to provide resistance.
Note the levels of interest below:
- Pivot support is noted at 135.93, 135.6, 135.28
- Pivot resistance is noted at 136.57, 136.89, 137.22
| Levels | Levels.1 |
|---|---|
| Previous Daily High | 136.56 |
| Previous Daily Low | 135.92 |
| Previous Weekly High | 136.52 |
| Previous Weekly Low | 133.92 |
| Previous Monthly High | 134.78 |
| Previous Monthly Low | 127.22 |
| Daily Fibonacci 38.2% | 136.16 |
| Daily Fibonacci 61.8% | 136.31 |
| Daily Pivot Point S1 | 135.93 |
| Daily Pivot Point S2 | 135.60 |
| Daily Pivot Point S3 | 135.28 |
| Daily Pivot Point R1 | 136.57 |
| Daily Pivot Point R2 | 136.89 |
| Daily Pivot Point R3 | 137.22 |
[/s2If]
Join Our Telegram Group


