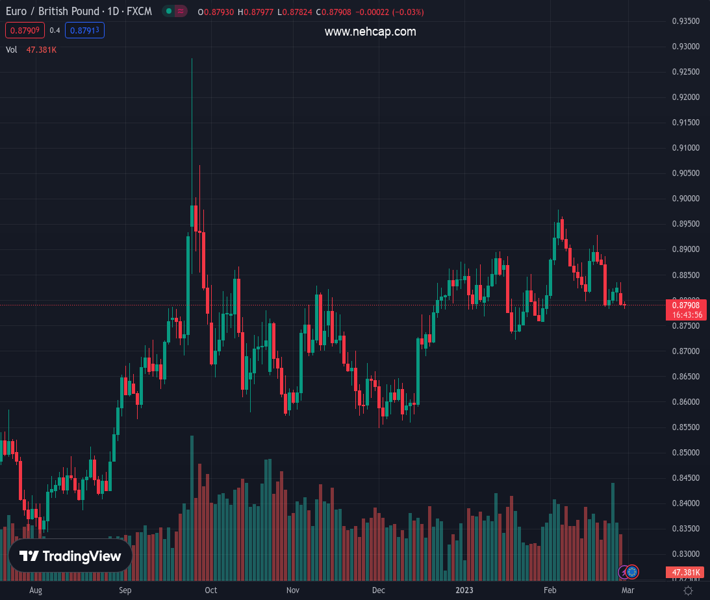
#EURGBP @ 0.87901 holds lower ground at monthly bottom, extends pullback from 50-DMA., @nehcap view: Further downside expected (Pivot Orderbook analysis)
…
This is a premium post.
[s2If !current_user_can(access_s2member_level4)]Please register for PREMIUM VERSION HERE to read full post below containing analysis. In case of any error or you think you are not able to read the full post below, please email us at support#nehcap.com [lwa][/s2If] [s2If current_user_can(access_s2member_level4)]
- EUR/GBP holds lower ground at monthly bottom, extends pullback from 50-DMA.
- Lower-high formation keeps sellers hopeful amid bearish MACD signals.
- 2.5-month-old ascending support line, 100-DMA lures bears during further downside.
- Bulls need validation from three-week-long falling resistance line.
The pair currently trades last at 0.87901.
The previous day high was 0.8836 while the previous day low was 0.879. The daily 38.2% Fib levels comes at 0.8807, expected to provide resistance. Similarly, the daily 61.8% fib level is at 0.8818, expected to provide resistance.
EUR/GBP remains depressed around 0.8790, refreshing the monthly low, as traders brace for Tuesday’s European session. In doing so, the cross-currency pair extends the previous day’s pullback from the 50-DMA hurdle amid bearish MACD signals.
Also keeping the EUR/GBP sellers hopeful is the pair’s lower high formation, as portrayed by a three-week-old descending resistance line surrounding 0.8850 by the press time.
That said, the pair sellers appear well-set to drop towards an upward-sloping support line from December 19, 2022, close to 0.8760. However, the pair’s further downside is likely to be limited by the 100-DMA support level near 0.8750.
In a case where the cross-currency pair remains weak past 0.8750, the lows marked in January 2023 and late December 2022, respectively near 0.8720 and 0.8690, could act as additional downside filters.
Meanwhile, EUR/GBP recovery remains elusive unless the quote stays below the 50-DMA hurdle of 0.8831.
Even if the quote rises past 0.8831, the aforementioned three-week-old resistance line could challenge the pair buyers near 0.8850.
Following that, the mid-February swing high surrounding 0.8930 appears the last defense of the EUR/GBP bears.
Trend: Further downside expected
Technical Levels: Supports and Resistances
EURGBP currently trading at 0.879 at the time of writing. Pair opened at 0.8798 and is trading with a change of -0.09% % .
| Overview | Overview.1 | |
|---|---|---|
| 0 | Today last price | 0.879 |
| 1 | Today Daily Change | -0.0008 |
| 2 | Today Daily Change % | -0.09% |
| 3 | Today daily open | 0.8798 |
The pair is trading below its 20 Daily moving average @ 0.8862, below its 50 Daily moving average @ 0.883 , above its 100 Daily moving average @ 0.8752 and above its 200 Daily moving average @ 0.8662
| Trends | Trends.1 | |
|---|---|---|
| 0 | Daily SMA20 | 0.8862 |
| 1 | Daily SMA50 | 0.8830 |
| 2 | Daily SMA100 | 0.8752 |
| 3 | Daily SMA200 | 0.8662 |
The previous day high was 0.8836 while the previous day low was 0.879. The daily 38.2% Fib levels comes at 0.8807, expected to provide resistance. Similarly, the daily 61.8% fib level is at 0.8818, expected to provide resistance.
Note the levels of interest below:
- Pivot support is noted at 0.878, 0.8762, 0.8734
- Pivot resistance is noted at 0.8826, 0.8854, 0.8872
| Levels | Levels.1 |
|---|---|
| Previous Daily High | 0.8836 |
| Previous Daily Low | 0.8790 |
| Previous Weekly High | 0.8892 |
| Previous Weekly Low | 0.8784 |
| Previous Monthly High | 0.8897 |
| Previous Monthly Low | 0.8722 |
| Daily Fibonacci 38.2% | 0.8807 |
| Daily Fibonacci 61.8% | 0.8818 |
| Daily Pivot Point S1 | 0.8780 |
| Daily Pivot Point S2 | 0.8762 |
| Daily Pivot Point S3 | 0.8734 |
| Daily Pivot Point R1 | 0.8826 |
| Daily Pivot Point R2 | 0.8854 |
| Daily Pivot Point R3 | 0.8872 |
[/s2If]
Join Our Telegram Group


