#AUDUSD @ 0.67376 capped its downfall on risk-on sentiment and mixed US data. (Pivot Orderbook analysis)
…
This is a premium post.
[s2If !current_user_can(access_s2member_level4)]Please register for PREMIUM VERSION HERE to read full post below containing analysis. In case of any error or you think you are not able to read the full post below, please email us at support#nehcap.com [lwa][/s2If] [s2If current_user_can(access_s2member_level4)]
- AUD/USD capped its downfall on risk-on sentiment and mixed US data.
- Durable Good Orders and Pending Home Sales showed mixed readings.
- Fed’s Jefferson commented that tackling inflation to the 2% target would not be easy.
- AUD/USD Price Analysis: To continue its downtrend as it stays below 0.6825.
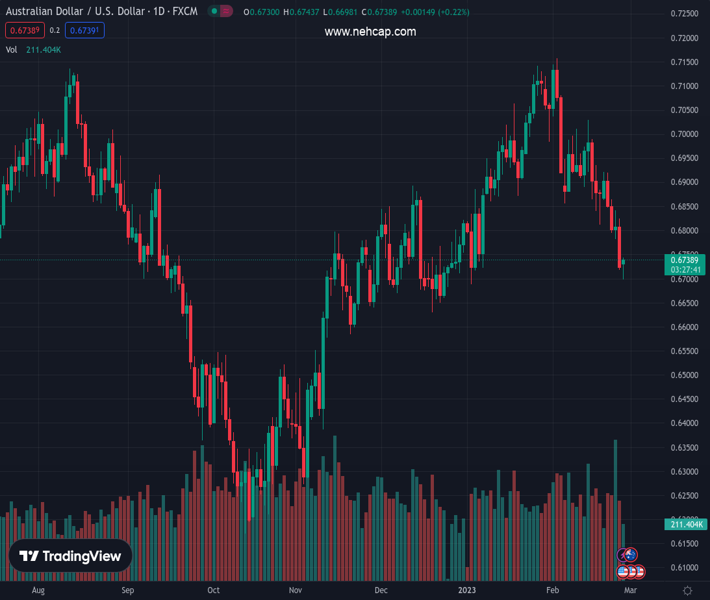
The pair currently trades last at 0.67376.
The previous day high was 0.6824 while the previous day low was 0.6719. The daily 38.2% Fib levels comes at 0.6759, expected to provide resistance. Similarly, the daily 61.8% fib level is at 0.6784, expected to provide resistance.
The AUD/USD trims some of its earlier losses though it remains below the 0.6800 figure after posting a daily high of 0.6743 as the week begins. Dismal economic data in the United States (US) and risk appetite improvement are two reasons that weighed on the US Dollar (USD) and boosted the Australian Dollar (AUD). At the time of writing, the AUD/USD exchanges hands at 0.6739, slightly above its opening price.
Wall Street continues to trade in the green despite a bad Durable Goods Orders report for January in the United States (US). Durable orders plunged -4.5%, vs. a 5.1% gain in December. Excluding Transportation, also known as core orders, rose 0.7% against a no change.
Further data in the US showed an improvement in Pending Home Sales, with the YoY reading sliding less than the -33.9% estimated to -24.1%. On a monthly basis, sales jumped 8.1% vs. expectations of 1%. Pending Home sales have posted two straight reports above zero for the first time since 2020.
The US Dollar Index (DXY), which measures the US Dollar value in relation to six currencies, fell 0.52% to 104.725, reversing gains from last Friday driven by an increase in the US Federal Reserve’s (Fed) preferred inflation indicator, the Core PCE. After data on goods orders, the DXY decreased from approximately 105.100 to current quotations.
In the meantime, speculations that the Fed will tighten monetary conditions still after Governor Phillip Jefferson noted that inflation is too high and reiterated the Fed’s commitment to getting back (inflation) to 2%. He added that “under no illusion,” it will be easy to get inflation back to 2%.
The AUD/USD downtrend remains in play once the pair collapsed below the 200 and 100-day EMAs, at 0.6857 and 0.6825, respectively. Furthermore, the Relative Strength Index (RSI) accelerated its downtrend but is shy of reaching oversold conditions. This means there is enough room for AUD/USD sellers to drag prices down. Therefore, the AUD/USD first support would be 0.6700, followed by December’s 20 low of 0.6629, ahead of 0.6600.
Technical Levels: Supports and Resistances
AUDUSD currently trading at 0.674 at the time of writing. Pair opened at 0.6727 and is trading with a change of 0.19 % .
| Overview | Overview.1 | |
|---|---|---|
| 0 | Today last price | 0.6740 |
| 1 | Today Daily Change | 0.0013 |
| 2 | Today Daily Change % | 0.1900 |
| 3 | Today daily open | 0.6727 |
The pair is trading below its 20 Daily moving average @ 0.693, below its 50 Daily moving average @ 0.6893 , above its 100 Daily moving average @ 0.6726 and below its 200 Daily moving average @ 0.6801
| Trends | Trends.1 | |
|---|---|---|
| 0 | Daily SMA20 | 0.6930 |
| 1 | Daily SMA50 | 0.6893 |
| 2 | Daily SMA100 | 0.6726 |
| 3 | Daily SMA200 | 0.6801 |
The previous day high was 0.6824 while the previous day low was 0.6719. The daily 38.2% Fib levels comes at 0.6759, expected to provide resistance. Similarly, the daily 61.8% fib level is at 0.6784, expected to provide resistance.
Note the levels of interest below:
- Pivot support is noted at 0.6689, 0.6651, 0.6584
- Pivot resistance is noted at 0.6795, 0.6862, 0.69
| Levels | Levels.1 |
|---|---|
| Previous Daily High | 0.6824 |
| Previous Daily Low | 0.6719 |
| Previous Weekly High | 0.6921 |
| Previous Weekly Low | 0.6719 |
| Previous Monthly High | 0.7143 |
| Previous Monthly Low | 0.6688 |
| Daily Fibonacci 38.2% | 0.6759 |
| Daily Fibonacci 61.8% | 0.6784 |
| Daily Pivot Point S1 | 0.6689 |
| Daily Pivot Point S2 | 0.6651 |
| Daily Pivot Point S3 | 0.6584 |
| Daily Pivot Point R1 | 0.6795 |
| Daily Pivot Point R2 | 0.6862 |
| Daily Pivot Point R3 | 0.6900 |
[/s2If]
Join Our Telegram Group
")


