#AUDUSD @ 0.70826 comes under some selling pressure on Monday and hits a fresh daily low in the last hour. (Pivot Orderbook analysis)
…
This is a premium post.
[s2If !current_user_can(access_s2member_level4)]Please register for PREMIUM VERSION HERE to read full post below containing analysis. In case of any error or you think you are not able to read the full post below, please email us at support#nehcap.com [lwa][/s2If] [s2If current_user_can(access_s2member_level4)]
- AUD/USD comes under some selling pressure on Monday and hits a fresh daily low in the last hour.
- A weaker tone around the equity markets is seen exerting pressure on the risk-sensitive Aussie.
- Bets for smaller Fed rate hikes keep the USD depressed and should help limit losses for the major.
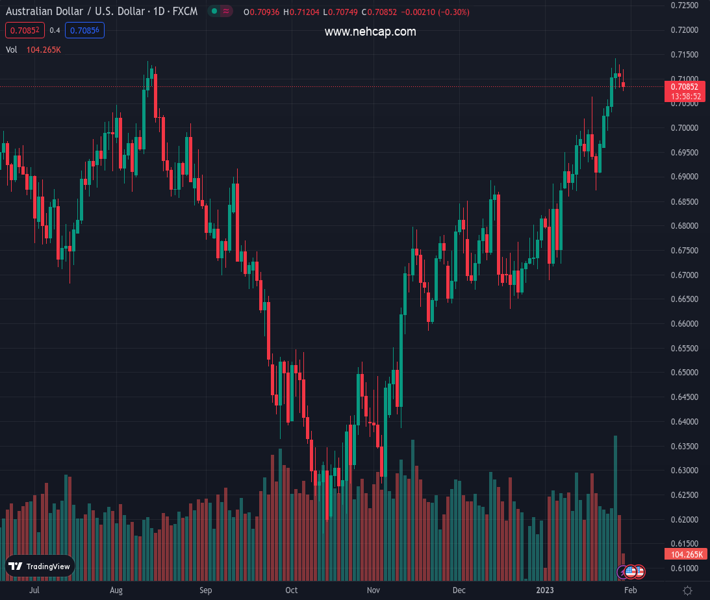
The pair currently trades last at 0.70826.
The previous day high was 0.713 while the previous day low was 0.7082. The daily 38.2% Fib levels comes at 0.71, expected to provide resistance. Similarly, the daily 61.8% fib level is at 0.7111, expected to provide resistance.
The AUD/USD pair attracts some sellers following an early uptick to the 0.7120 area on Monday and remains on the defensive through the early European session on Monday. Spot prices drop to a three-day low, around the 0.7075 region in the last hour, though any meaningful downside still seems elusive.
A softer risk tone – as depicted by a weaker trading sentiment around the equity markets – is seen as a key factor driving flows away from the risk-sensitive Aussie. Despite China’s move to scale back its strict zero-COVID policy in December, the worst yet COVID-19 outbreak in the country has been fueling uncertainty about a strong economic recovery. This, in turn, tempers investors’ appetite for riskier assets and keeps a lid on any optimism in the markets.
The downside for the AUD/USD pair, meanwhile, is likely to remain cushioned, at least for now, amid subdued US Dollar price action. In fact, the USD Index, which tracks the Greenback against a basket of currencies, languishes near a nine-month low amid firming expectations for a less aggressive policy tightening by the Fed. The markets seem convinced that the US central bank will soften its hawkish stance and expect a smaller 25 bps rate hike on Wednesday.
The bets were lifted by Friday’s release of the US Personal Consumption Expenditures (PCE) data, which showed that the Core PCE Price Index fell to the 4.4% YoY rate in December from the 4.7% previous. That said, other US macro data released recently pointed to a resilient economy and backed the case for the Fed to maintain its hawkish stance for longer. Hence, the focus will remain on the outcome of a two-day FOMC meeting, which might provide cues on future rate hikes.
Heading into the key central bank event risk, traders might refrain from placing aggressive bets and prefer to move to the sidelines. Apart from this, rising odds for an additional rate hike by the Reserve Bank of Australia (RBA) in February could underpin the Australian dollar and help limit any meaningful corrective pullback for the AUD/USD pair. This makes it prudent to wait for strong follow-through selling before confirming that spot prices have topped out.
Technical Levels: Supports and Resistances
AUDUSD currently trading at 0.7081 at the time of writing. Pair opened at 0.7108 and is trading with a change of -0.38 % .
| Overview | Overview.1 | |
|---|---|---|
| 0 | Today last price | 0.7081 |
| 1 | Today Daily Change | -0.0027 |
| 2 | Today Daily Change % | -0.3800 |
| 3 | Today daily open | 0.7108 |
The pair remains strongly bullish on the daily timeframe. It trades above its 20 SMA @ 0.6941, 50 SMA 0.6816, 100 SMA @ 0.6656 and 200 SMA @ 0.6812.
| Trends | Trends.1 | |
|---|---|---|
| 0 | Daily SMA20 | 0.6941 |
| 1 | Daily SMA50 | 0.6816 |
| 2 | Daily SMA100 | 0.6656 |
| 3 | Daily SMA200 | 0.6812 |
The previous day high was 0.713 while the previous day low was 0.7082. The daily 38.2% Fib levels comes at 0.71, expected to provide resistance. Similarly, the daily 61.8% fib level is at 0.7111, expected to provide resistance.
Note the levels of interest below:
- Pivot support is noted at 0.7084, 0.7059, 0.7036
- Pivot resistance is noted at 0.7131, 0.7154, 0.7178
| Levels | Levels.1 |
|---|---|
| Previous Daily High | 0.7130 |
| Previous Daily Low | 0.7082 |
| Previous Weekly High | 0.7143 |
| Previous Weekly Low | 0.6960 |
| Previous Monthly High | 0.6893 |
| Previous Monthly Low | 0.6629 |
| Daily Fibonacci 38.2% | 0.7100 |
| Daily Fibonacci 61.8% | 0.7111 |
| Daily Pivot Point S1 | 0.7084 |
| Daily Pivot Point S2 | 0.7059 |
| Daily Pivot Point S3 | 0.7036 |
| Daily Pivot Point R1 | 0.7131 |
| Daily Pivot Point R2 | 0.7154 |
| Daily Pivot Point R3 | 0.7178 |
[/s2If]
Join Our Telegram Group


