#AUDUSD @ 0.70429 is aiming to print a fresh five-month high above 0.7060 ahead of Australian inflation. (Pivot Orderbook analysis)
…
This is a premium post.
[s2If !current_user_can(access_s2member_level4)]Please register for PREMIUM VERSION HERE to read full post below containing analysis. In case of any error or you think you are not able to read the full post below, please email us at support#nehcap.com [lwa][/s2If] [s2If current_user_can(access_s2member_level4)]
- AUD/USD is aiming to print a fresh five-month high above 0.7060 ahead of Australian inflation.
- The USD Index has found an intermediate cushion around 101.50, however, the downside bias is still solid.
- A bullish momentum will be triggered after a jump by the RSI (14) into the bullish range of 60.00-80.00.
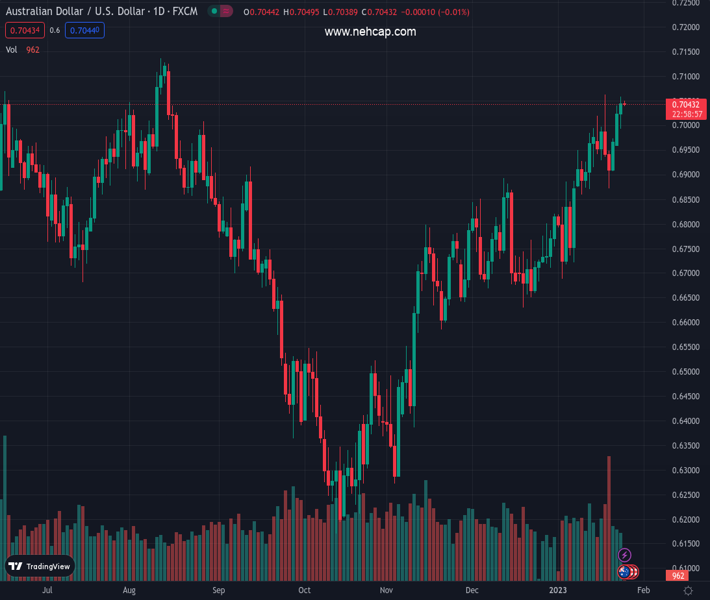
The pair currently trades last at 0.70429.
The previous day high was 0.704 while the previous day low was 0.696. The daily 38.2% Fib levels comes at 0.7009, expected to provide support. Similarly, the daily 61.8% fib level is at 0.699, expected to provide support.
The AUD/USD pair is juggling in a narrow range above the crucial support of 0.7040 in the early Asian session. The Aussie asset is on the verge of hitting a five-month high at 0.7060 ahead of the release of the Australian Consumer Price Index (CPI) data. The consensus claims an escalation in the annual inflation to 7.5% from the prior release of 7.3%. While monthly inflation is seen sharply higher at 7.7% from the former release of 7.3%.
Investors’ risk appetite has improved again as S&P500 futures have recovered their marginal losses witnessed on Tuesday. The US Dollar Index (DXY) has found an intermediate cushion around 101.50, however, the downside bias is still solid.
AUD/USD is marching towards the five-month high plotted from January 18 high at 0.7064 on an hourly scale. The Aussie asset displayed a V-shape recovery from January 19 low around 0.6875, which provides confidence that bullish momentum is present in the current trend.
Upward-sloping 20-and 50-period Exponential Moving Averages (EMAs) at 0.7035 and 0.7014 respectively, add to the upside filters.
What is interesting in the current scenario is the inventory adjustment phase below the critical resistance of 0.7060. This seems to be an inventory accumulation in a bullish trend, which favors the continuation of the upside journey after the conclusion.
Also, the Relative Strength Index (RSI) (14) is looking to shift into the bullish range of 60.00-80.00, which will trigger the bullish momentum.
For more upside, the Aussie asset needs to surpass the five-month high around 0.7060 decisively, which will drive the major towards August 11 high at 0.7137. A breach of the latter will expose the asset to the round-level resistance at 0.7200.
On the contrary, a downside move below December 29 low at 0.6710 will drag the major further toward December 22 low at 0.6650 followed by November 21 low at 0.6585.
Technical Levels: Supports and Resistances
AUDUSD currently trading at 0.7047 at the time of writing. Pair opened at 0.7026 and is trading with a change of 0.3 % .
| Overview | Overview.1 | |
|---|---|---|
| 0 | Today last price | 0.7047 |
| 1 | Today Daily Change | 0.0021 |
| 2 | Today Daily Change % | 0.3000 |
| 3 | Today daily open | 0.7026 |
The pair remains strongly bullish on the daily timeframe. It trades above its 20 SMA @ 0.6875, 50 SMA 0.6786, 100 SMA @ 0.6643 and 200 SMA @ 0.6818.
| Trends | Trends.1 | |
|---|---|---|
| 0 | Daily SMA20 | 0.6875 |
| 1 | Daily SMA50 | 0.6786 |
| 2 | Daily SMA100 | 0.6643 |
| 3 | Daily SMA200 | 0.6818 |
The previous day high was 0.704 while the previous day low was 0.696. The daily 38.2% Fib levels comes at 0.7009, expected to provide support. Similarly, the daily 61.8% fib level is at 0.699, expected to provide support.
Note the levels of interest below:
- Pivot support is noted at 0.6978, 0.6929, 0.6898
- Pivot resistance is noted at 0.7058, 0.7089, 0.7137
| Levels | Levels.1 |
|---|---|
| Previous Daily High | 0.7040 |
| Previous Daily Low | 0.6960 |
| Previous Weekly High | 0.7064 |
| Previous Weekly Low | 0.6872 |
| Previous Monthly High | 0.6893 |
| Previous Monthly Low | 0.6629 |
| Daily Fibonacci 38.2% | 0.7009 |
| Daily Fibonacci 61.8% | 0.6990 |
| Daily Pivot Point S1 | 0.6978 |
| Daily Pivot Point S2 | 0.6929 |
| Daily Pivot Point S3 | 0.6898 |
| Daily Pivot Point R1 | 0.7058 |
| Daily Pivot Point R2 | 0.7089 |
| Daily Pivot Point R3 | 0.7137 |
[/s2If]
Join Our Telegram Group
")


