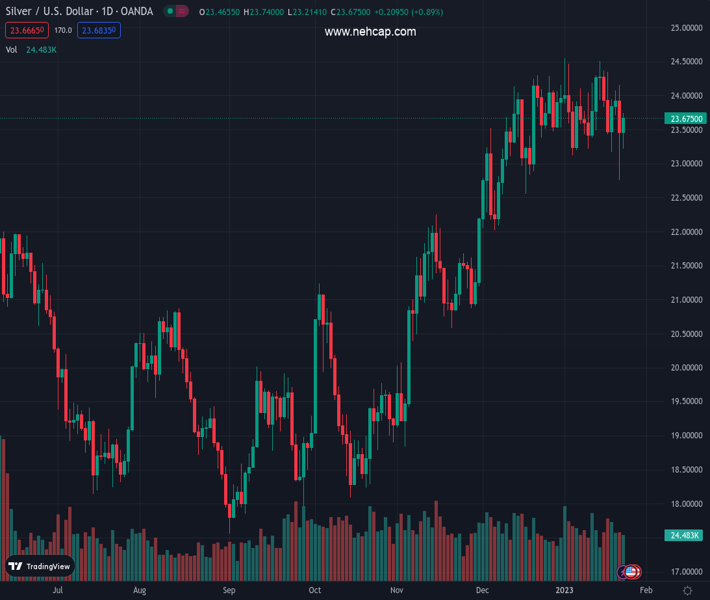
#XAGUSD @ 23.654 Silver recovered some bright on Tuesday and gained 0.90% after plummeting more than 1% on Monday. (Pivot Orderbook analysis)
…
This is a premium post.
[s2If !current_user_can(access_s2member_level4)]Please register for PREMIUM VERSION HERE to read full post below containing analysis. In case of any error or you think you are not able to read the full post below, please email us at support#nehcap.com [lwa][/s2If] [s2If current_user_can(access_s2member_level4)]
- Silver recovered some bright on Tuesday and gained 0.90% after plummeting more than 1% on Monday.
- XAG/USD Price Analysis: Rally capped at the 20-day EMA.
The pair currently trades last at 23.654.
The previous day high was 24.16 while the previous day low was 22.76. The daily 38.2% Fib levels comes at 23.3, expected to provide support. Similarly, the daily 61.8% fib level is at 23.62, expected to provide support.
Silver price recovers some ground and is back above Monday’s daily close, still struggling to break the 20-day Exponential Moving Average (EMA) at $23.67 a troy ounce. However, it trimmed some losses after nosediving sharply underneath the 50-day EMA and reaching a 5-day low of $22.76. The XAG/USD is trading at 23.64, up by 0.85%, as of typing.
After visiting the 50-day EMA, XAG/USD resumed its uptrend, though it encountered solid resistance in the form of the 20-day EMA at 23.67. Nevertheless, bulls could remain hopeful that XAG/USD could continue to rise further as it reclaimed a three-week upslope support trendline around $23.40s.
Looking ahead, if Silver’s prices break above the 20-day EMA, that could open the door for further upside, exposing crucial resistance levels. Firstly, the psychological $24.00 a troy ounce, followed by the YTD high of $24.54. A breach of the latter and the $25.00 figure is up for grabs.
Otherwise, the XAG/USD first support would be $23.40. Once cleared, sellers would likely mount and drag prices to the 50-day EMA at $22.99. A decisive break could send the XAG/USD sliding toward December’s 16 daily low at $22.56.
Technical Levels: Supports and Resistances
XAGUSD currently trading at 23.67 at the time of writing. Pair opened at 23.45 and is trading with a change of 0.94 % .
| Overview | Overview.1 | |
|---|---|---|
| 0 | Today last price | 23.67 |
| 1 | Today Daily Change | 0.22 |
| 2 | Today Daily Change % | 0.94 |
| 3 | Today daily open | 23.45 |
The pair is trading below its 20 Daily moving average @ 23.79, above its 50 Daily moving average @ 23.01 , above its 100 Daily moving average @ 21.28 and above its 200 Daily moving average @ 21.03
| Trends | Trends.1 | |
|---|---|---|
| 0 | Daily SMA20 | 23.79 |
| 1 | Daily SMA50 | 23.01 |
| 2 | Daily SMA100 | 21.28 |
| 3 | Daily SMA200 | 21.03 |
The previous day high was 24.16 while the previous day low was 22.76. The daily 38.2% Fib levels comes at 23.3, expected to provide support. Similarly, the daily 61.8% fib level is at 23.62, expected to provide support.
Note the levels of interest below:
- Pivot support is noted at 22.76, 22.06, 21.36
- Pivot resistance is noted at 24.15, 24.86, 25.55
| Levels | Levels.1 |
|---|---|
| Previous Daily High | 24.16 |
| Previous Daily Low | 22.76 |
| Previous Weekly High | 24.51 |
| Previous Weekly Low | 23.17 |
| Previous Monthly High | 24.30 |
| Previous Monthly Low | 22.03 |
| Daily Fibonacci 38.2% | 23.30 |
| Daily Fibonacci 61.8% | 23.62 |
| Daily Pivot Point S1 | 22.76 |
| Daily Pivot Point S2 | 22.06 |
| Daily Pivot Point S3 | 21.36 |
| Daily Pivot Point R1 | 24.15 |
| Daily Pivot Point R2 | 24.86 |
| Daily Pivot Point R3 | 25.55 |
[/s2If]
Join Our Telegram Group
")


