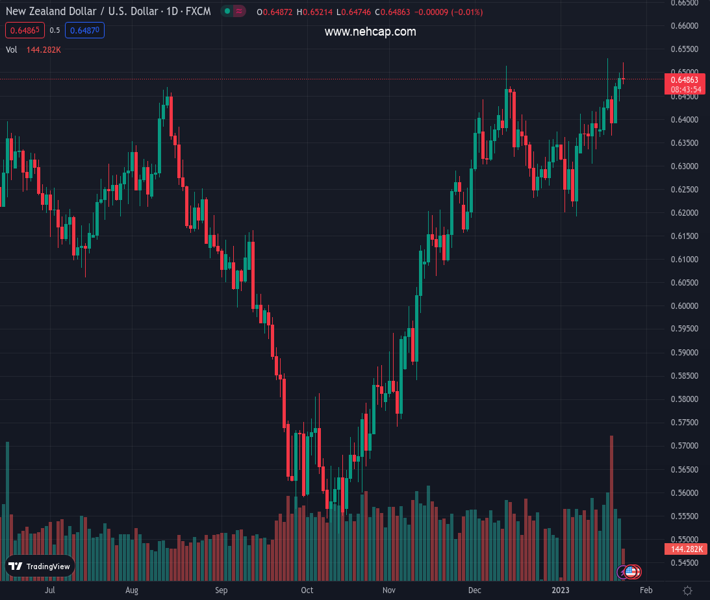
#NZDUSD @ 0.64841 attracts some intraday sellers amid a modest bounce from a multi-month low. (Pivot Orderbook analysis)
…
This is a premium post.
[s2If !current_user_can(access_s2member_level4)]Please register for PREMIUM VERSION HERE to read full post below containing analysis. In case of any error or you think you are not able to read the full post below, please email us at support#nehcap.com [lwa][/s2If] [s2If current_user_can(access_s2member_level4)]
- NZD/USD attracts some intraday sellers amid a modest bounce from a multi-month low.
- Recession fears take a toll on the risk sentiment and benefit the safe-haven greenback.
- Bets for smaller Fed rate hikes drag the US bond yields lower and cap gains for the USD.
- Traders eye US PMIs for some impetus ahead of NZ quarterly CPI report on Wednesday.
The pair currently trades last at 0.64841.
The previous day high was 0.65 while the previous day low was 0.6437. The daily 38.2% Fib levels comes at 0.6476, expected to provide support. Similarly, the daily 61.8% fib level is at 0.6461, expected to provide support.
The NZD/USD pair continues with its struggle to find acceptance above the 0.6500 psychological mark and retreats over 50 pips from a multi-day high touched earlier this Tuesday. Spot prices return to the lower end of the daily range, around the 0.6480-0.6475 region, heading into the North American session, though any meaningful decline seems elusive.
Worries about a deeper global economic downturn keep a lid on any optimism in the markets, which is evident from a fresh leg down in the equity markets. This, in turn, assists the safe-haven US Dollar to stage a modest recovery from a nine-month low and drives some flows away from the risk-sensitive Kiwi. That said, the prospects for a less aggressive policy tightening by the Fed might cap the upside for the greenback and lend support to the NZD/USD pair.
Investors seem convinced that the US central bank will soften its hawkish stance amid signs of easing inflationary pressures. In fact, the markets have been pricing in a smaller 25 bps rate hike move at the end of the upcoming policy meeting next week. This, in turn, exerts some downward pressure on the US Treasury bond yields and might continue to weigh on the buck. Traders also seem reluctant to place aggressive bets ahead of this week’s important macroeconomic data.
The quarterly consumer inflation report from New Zealand is scheduled for release during the early Asian session on Wednesday. This will be followed by the Advance Q4 GDP print and the Core PCE Price Index from the US on Thursday and Friday, respectively. The key focus, however, will remain on the highly-anticipated FOMC monetary policy decision. This will play a key role in driving the USD in the near term and help determine the near-term trajectory for the NZD/USD pair.
In the meantime, traders on Tuesday will take cues from the US economic docket, featuring the flash PMI prints and the Richmond Manufacturing Index. Apart from this, the US bond yields and the broader risk sentiment, will influence the USD price dynamics and provide some meaningful impetus to the NZD/USD pair. Nevertheless, the fundamental backdrop still seems tilted in favour of bullish traders, suggesting that any meaningful pullback might be seen as a buying opportunity.
Technical Levels: Supports and Resistances
NZDUSD currently trading at 0.6478 at the time of writing. Pair opened at 0.6487 and is trading with a change of -0.14 % .
| Overview | Overview.1 | |
|---|---|---|
| 0 | Today last price | 0.6478 |
| 1 | Today Daily Change | -0.0009 |
| 2 | Today Daily Change % | -0.1400 |
| 3 | Today daily open | 0.6487 |
The pair remains strongly bullish on the daily timeframe. It trades above its 20 SMA @ 0.636, 50 SMA 0.6318, 100 SMA @ 0.6068 and 200 SMA @ 0.6199.
| Trends | Trends.1 | |
|---|---|---|
| 0 | Daily SMA20 | 0.6360 |
| 1 | Daily SMA50 | 0.6318 |
| 2 | Daily SMA100 | 0.6068 |
| 3 | Daily SMA200 | 0.6199 |
The previous day high was 0.65 while the previous day low was 0.6437. The daily 38.2% Fib levels comes at 0.6476, expected to provide support. Similarly, the daily 61.8% fib level is at 0.6461, expected to provide support.
Note the levels of interest below:
- Pivot support is noted at 0.6449, 0.6412, 0.6386
- Pivot resistance is noted at 0.6512, 0.6538, 0.6575
| Levels | Levels.1 |
|---|---|
| Previous Daily High | 0.6500 |
| Previous Daily Low | 0.6437 |
| Previous Weekly High | 0.6531 |
| Previous Weekly Low | 0.6361 |
| Previous Monthly High | 0.6514 |
| Previous Monthly Low | 0.6230 |
| Daily Fibonacci 38.2% | 0.6476 |
| Daily Fibonacci 61.8% | 0.6461 |
| Daily Pivot Point S1 | 0.6449 |
| Daily Pivot Point S2 | 0.6412 |
| Daily Pivot Point S3 | 0.6386 |
| Daily Pivot Point R1 | 0.6512 |
| Daily Pivot Point R2 | 0.6538 |
| Daily Pivot Point R3 | 0.6575 |
[/s2If]
Join Our Telegram Group
")


