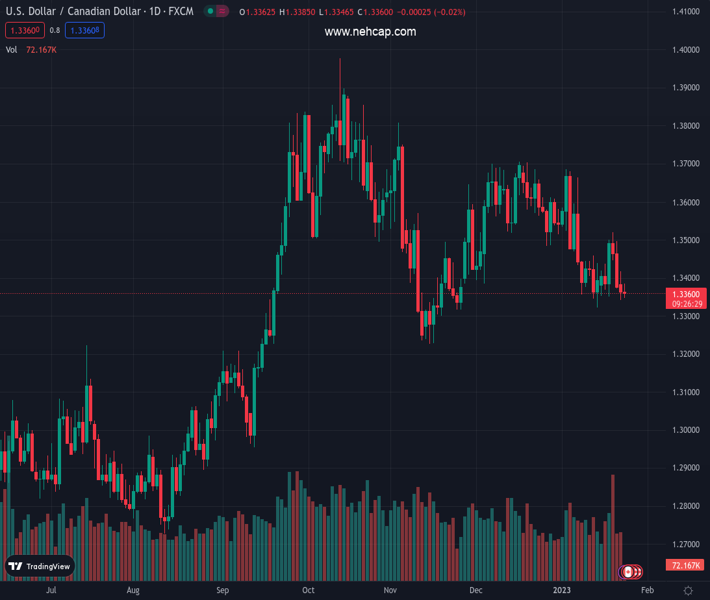
#USDCAD @ 1.33602 remains under some selling pressure for the fourth straight day on Tuesday. (Pivot Orderbook analysis)
…
This is a premium post.
[s2If !current_user_can(access_s2member_level4)]Please register for PREMIUM VERSION HERE to read full post below containing analysis. In case of any error or you think you are not able to read the full post below, please email us at support#nehcap.com [lwa][/s2If] [s2If current_user_can(access_s2member_level4)]
- USD/CAD remains under some selling pressure for the fourth straight day on Tuesday.
- Bullish crude oil prices underpin the Loonie and act as a headwind amid a weaker USD.
- Traders now eye the US macro data for some impetus ahead of the BoC on Wednesday.
The pair currently trades last at 1.33602.
The previous day high was 1.3418 while the previous day low was 1.3342. The daily 38.2% Fib levels comes at 1.3371, expected to provide resistance. Similarly, the daily 61.8% fib level is at 1.3389, expected to provide resistance.
The USD/CAD pair edges lower for the fourth successive day on Tuesday and remains depressed through the mid-European session. The pair is currently placed around mid-1.3300s, just a few pips above a one-week low touched on Monday and seems vulnerable to slide further.
Despite a softer risk tone, the safe-haven US Dollar struggles to capitalize on its modest intraday recovery from a nine-month low and acts as a headwind for the USD/CAD pair. Growing acceptance that the Fed will soften its hawkish stance amid signs of easing inflationary pressure turns out to be a key factor that continues to weigh on the greenback.
In fact, the markets have been pricing in a greater chance of a smaller 25 bps Fed rate hike move in February. This, along with softer US Treasury bond yields, keeps the USD bulls on the defensive. Apart from this, the recent rally in crude oil prices to over a one-month top underpins the commodity-linked Loonie and exerts pressure on the USD/CAD pair.
The aforementioned fundamental backdrop favours bearish traders and supports prospects for an extension of the USD/CAD pair’s recent downward trajectory. Even from a technical perspective, last week’s failure to find acceptance above the 100-day SMA validates the negative outlook and suggests that the path of least resistance for spot prices is to the downside.
Traders, however, seem reluctant to place aggressive bets and prefer to move to the sidelines ahead of this week’s key central bank event/data risk. The Bank of Canada is scheduled to announce its policy decision on Wednesday. This will be followed by the Advance Q4 GDP print and the Core PCE Price Index from the US on Thursday and Friday, respectively.
Hence, it will be prudent to wait for some follow-through selling below the monthly low, around the 1.3320 area, before placing fresh bearish bets. Traders now look to the US macro data – the flash PMI prints and the Richmond Manufacturing Index, which might influence the USD. This, along with oil price dynamics should provide some impetus to the USD/CAD pair.
Technical Levels: Supports and Resistances
USDCAD currently trading at 1.3357 at the time of writing. Pair opened at 1.3374 and is trading with a change of -0.13 % .
| Overview | Overview.1 | |
|---|---|---|
| 0 | Today last price | 1.3357 |
| 1 | Today Daily Change | -0.0017 |
| 2 | Today Daily Change % | -0.1300 |
| 3 | Today daily open | 1.3374 |
The pair is trading below its 20 Daily moving average @ 1.3474, below its 50 Daily moving average @ 1.3501 , below its 100 Daily moving average @ 1.3515 and above its 200 Daily moving average @ 1.3194
| Trends | Trends.1 | |
|---|---|---|
| 0 | Daily SMA20 | 1.3474 |
| 1 | Daily SMA50 | 1.3501 |
| 2 | Daily SMA100 | 1.3515 |
| 3 | Daily SMA200 | 1.3194 |
The previous day high was 1.3418 while the previous day low was 1.3342. The daily 38.2% Fib levels comes at 1.3371, expected to provide resistance. Similarly, the daily 61.8% fib level is at 1.3389, expected to provide resistance.
Note the levels of interest below:
- Pivot support is noted at 1.3338, 1.3302, 1.3262
- Pivot resistance is noted at 1.3414, 1.3453, 1.3489
| Levels | Levels.1 |
|---|---|
| Previous Daily High | 1.3418 |
| Previous Daily Low | 1.3342 |
| Previous Weekly High | 1.3521 |
| Previous Weekly Low | 1.3351 |
| Previous Monthly High | 1.3705 |
| Previous Monthly Low | 1.3385 |
| Daily Fibonacci 38.2% | 1.3371 |
| Daily Fibonacci 61.8% | 1.3389 |
| Daily Pivot Point S1 | 1.3338 |
| Daily Pivot Point S2 | 1.3302 |
| Daily Pivot Point S3 | 1.3262 |
| Daily Pivot Point R1 | 1.3414 |
| Daily Pivot Point R2 | 1.3453 |
| Daily Pivot Point R3 | 1.3489 |
[/s2If]
Join Our Telegram Group
")


