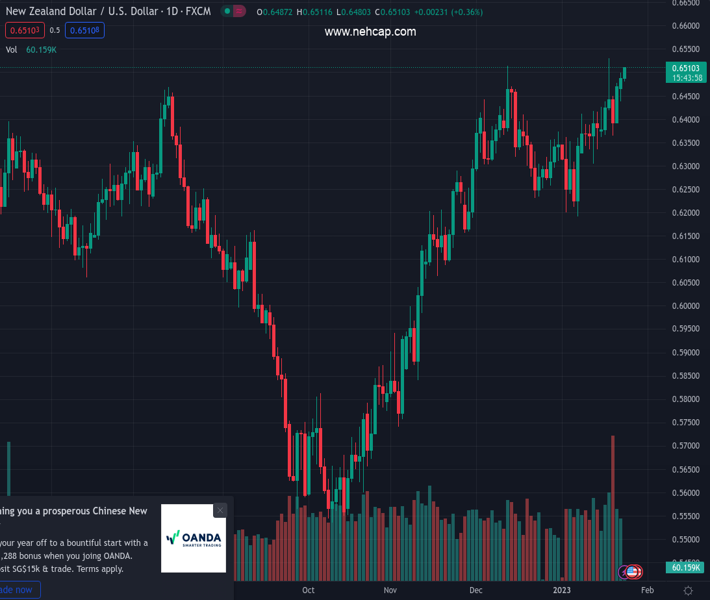
#NZDUSD @ 0.65108 has overstepped the 0.6500 resistance amid a cheerful market mood. (Pivot Orderbook analysis)
…
This is a premium post.
[s2If !current_user_can(access_s2member_level4)]Please register for PREMIUM VERSION HERE to read full post below containing analysis. In case of any error or you think you are not able to read the full post below, please email us at support#nehcap.com [lwa][/s2If] [s2If current_user_can(access_s2member_level4)]
- NZD/USD has overstepped the 0.6500 resistance amid a cheerful market mood.
- The New Zealand Dollar is driving the Kiwi asset towards the upper portion of the Rising Channel.
- An oscillation in the bullish range by the RSI (14) indicates more upside ahead.
The pair currently trades last at 0.65108.
The previous day high was 0.65 while the previous day low was 0.6437. The daily 38.2% Fib levels comes at 0.6476, expected to provide support. Similarly, the daily 61.8% fib level is at 0.6461, expected to provide support.
The NZD/USD pair surpassed the psychological resistance of 0.6500 in the early European session. The kiwi asset has picked strength as the US Dollar Index (DXY) has witnessed immense pressure after failing to recapture Monday’s high at 101.87. The USD Index has refreshed its day’s low at 101.47, portraying a risk appetite theme in the market.
The S&P500 futures have managed to recover their morning losses and have turned positive. Meanwhile, the 10-year US Treasury yields are struggling at around 3.52%.
NZD/USD is marching towards the upper portion of the Rising Channel chart pattern placed on a two-hour scale. The upper portion of the Rising Channel is placed from December 28 high at 0.6356 while the lower portion of the chart pattern is plotted from January 6 low at 0.6190.
The 20-period Exponential Moving Average (EMA) at 0.6464 is acting as a major support for the New Zealand bulls.
Meanwhile, the Relative Strength Index (RSI) (14) is oscillating in a bullish range of 60.00-80.00, which indicates that the upside momentum is firmer.
For an upside move, the asset needs to surpass Wednesday’s high at 0.6530, which will drive the asset toward June 3 high at 0.6576. A breach of the latter will expose the asset to the round-level resistance at 0.6600.
On the flip side, a breakdown below January 16 high at 0.6426 will drag the Kiwi asset toward January 17 low at 0.6366 followed by January 12 low around 0.6300.
Technical Levels: Supports and Resistances
NZDUSD currently trading at 0.6506 at the time of writing. Pair opened at 0.6487 and is trading with a change of 0.29 % .
| Overview | Overview.1 | |
|---|---|---|
| 0 | Today last price | 0.6506 |
| 1 | Today Daily Change | 0.0019 |
| 2 | Today Daily Change % | 0.2900 |
| 3 | Today daily open | 0.6487 |
The pair remains strongly bullish on the daily timeframe. It trades above its 20 SMA @ 0.636, 50 SMA 0.6318, 100 SMA @ 0.6068 and 200 SMA @ 0.6199.
| Trends | Trends.1 | |
|---|---|---|
| 0 | Daily SMA20 | 0.6360 |
| 1 | Daily SMA50 | 0.6318 |
| 2 | Daily SMA100 | 0.6068 |
| 3 | Daily SMA200 | 0.6199 |
The previous day high was 0.65 while the previous day low was 0.6437. The daily 38.2% Fib levels comes at 0.6476, expected to provide support. Similarly, the daily 61.8% fib level is at 0.6461, expected to provide support.
Note the levels of interest below:
- Pivot support is noted at 0.6449, 0.6412, 0.6386
- Pivot resistance is noted at 0.6512, 0.6538, 0.6575
| Levels | Levels.1 |
|---|---|
| Previous Daily High | 0.6500 |
| Previous Daily Low | 0.6437 |
| Previous Weekly High | 0.6531 |
| Previous Weekly Low | 0.6361 |
| Previous Monthly High | 0.6514 |
| Previous Monthly Low | 0.6230 |
| Daily Fibonacci 38.2% | 0.6476 |
| Daily Fibonacci 61.8% | 0.6461 |
| Daily Pivot Point S1 | 0.6449 |
| Daily Pivot Point S2 | 0.6412 |
| Daily Pivot Point S3 | 0.6386 |
| Daily Pivot Point R1 | 0.6512 |
| Daily Pivot Point R2 | 0.6538 |
| Daily Pivot Point R3 | 0.6575 |
[/s2If]
Join Our Telegram Group
")


