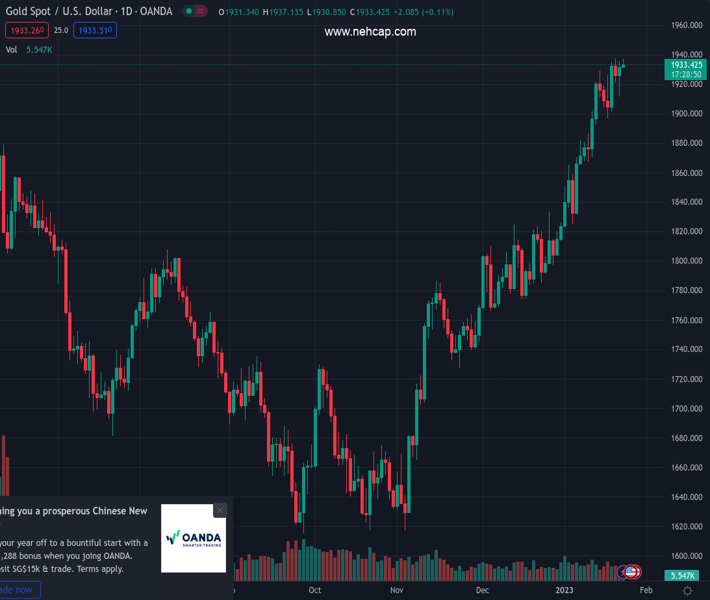
#XAUUSD @ 1,932.79 Gold price retreats from intraday high as bulls seek fresh clues to keep the reins., @nehcap view: Pullback expected (Pivot Orderbook analysis)
…
This is a premium post.
[s2If !current_user_can(access_s2member_level4)]Please register for PREMIUM VERSION HERE to read full post below containing analysis. In case of any error or you think you are not able to read the full post below, please email us at support#nehcap.com [lwa][/s2If] [s2If current_user_can(access_s2member_level4)]
- Gold price retreats from intraday high as bulls seek fresh clues to keep the reins.
- Challenges to US-China ties, mixed PMIs from Asia-Pacific majors probe XAU/USD bulls.
- China holidays, Fed blackout restrict momentum as Gold traders await US preliminary PMIs.
The pair currently trades last at 1932.79.
The previous day high was 1935.62 while the previous day low was 1911.45. The daily 38.2% Fib levels comes at 1926.39, expected to provide support. Similarly, the daily 61.8% fib level is at 1920.68, expected to provide support.
Gold price (XAU/USD) slides from the intraday high to $1,932 during early Tuesday morning in Europe. In doing so, the bullion price reacts to the latest challenges to sentiment amid an inactive market performance due to the lack of major data/events, as well as the absence of China traders and the Fed talks.
That said, the headlines suggesting the US confrontation with China over companies’ ties to the Russian war effort seemed to have probed the risk appetite at the latest. On the same line could be the talks surrounding the US debt ceiling in the Senate.
On the same line, an increase in the US inflation expectations, as per the 10-year and 5-year breakeven inflation rates from the St. Louis Federal Reserve (FRED) data, rise for the third consecutive day to 2.28% each and justify the pre-blackout hawkish Fed comments and challenge the sentiment.
Alternatively, softer prints of the US Conference Board’s Leading Index for December joined the lines of previous downbeat data from the US and signaled to ease inflation fears in the world’s largest economy, which in turn suggests less need for the Fed to be hawkish in February. It’s worth noting that the market players do expect a softer Fed rate hike in February and policy pivot afterward, which in turn weigh on the US Dollar.
It’s worth mentioning that the first readings of January’s activity data from Japan, Australia and New Zealand came in mixed, mostly positive, which in turn pushed back the looming recession fears but failed to inspire Gold buyers.
Amid these plays, the S&P 500 Futures resist following Wall Street’s gains while retreating from the six-week high marked the previous day, making rounds to 4,030-35 at the latest. On the same line, the US 10-year and two-year Treasury bond yields snap three-day recovery moves by struggling around 3.51% and 4.21% by the press time.
Looking forward, the Gold price may witness a pullback amid a cautious mood ahead of the first readings of January’s S&P Global PMIs and the fourth-quarter (Q4) Gross Domestic Product (GDP).
Gold price eases from the weekly bullish triangle’s top line as the yellow metal pares intraday gains around $1,940. The pullback moves also gain support from the RSI (14) retreat and the easing bullish bias of the MACD.
As a result, the XAU/USD price is likely to decline towards the $1,920 support confluence including the 100-Hour Moving Average (HMA), the stated triangle’s support line and the previous resistance line from January.
It’s worth noting, however, that the Gold price weakness past $1,920 won’t hesitate to break the $1,900 threshold while highlighting the monthly low surrounding $1,825 as the next stop for the XAU/USD bears.
Alternatively, an upside clearance of the $1,940 hurdle could quickly propel the Gold price towards the 61.8% Fibonacci Expansion (FE) of the metal’s moves between January 12 and 23, near $1,952.
Following that, March 2022 peak surrounding $1,966 will be the focus of the XAU/USD bulls.
Overall, Gold price is likely to pare intraday gains but the bullish trend remains intact, at least in the short term, unless breaking the $1,920 level.
Trend: Pullback expected
Technical Levels: Supports and Resistances
XAUUSD currently trading at 1932.18 at the time of writing. Pair opened at 1931.26 and is trading with a change of 0.05% % .
| Overview | Overview.1 | |
|---|---|---|
| 0 | Today last price | 1932.18 |
| 1 | Today Daily Change | 0.92 |
| 2 | Today Daily Change % | 0.05% |
| 3 | Today daily open | 1931.26 |
The pair remains strongly bullish on the daily timeframe. It trades above its 20 SMA @ 1871.86, 50 SMA 1815.68, 100 SMA @ 1746.33 and 200 SMA @ 1775.73.
| Trends | Trends.1 | |
|---|---|---|
| 0 | Daily SMA20 | 1871.86 |
| 1 | Daily SMA50 | 1815.68 |
| 2 | Daily SMA100 | 1746.33 |
| 3 | Daily SMA200 | 1775.73 |
The previous day high was 1935.62 while the previous day low was 1911.45. The daily 38.2% Fib levels comes at 1926.39, expected to provide support. Similarly, the daily 61.8% fib level is at 1920.68, expected to provide support.
Note the levels of interest below:
- Pivot support is noted at 1916.6, 1901.94, 1892.43
- Pivot resistance is noted at 1940.77, 1950.28, 1964.94
| Levels | Levels.1 |
|---|---|
| Previous Daily High | 1935.62 |
| Previous Daily Low | 1911.45 |
| Previous Weekly High | 1937.57 |
| Previous Weekly Low | 1896.63 |
| Previous Monthly High | 1833.38 |
| Previous Monthly Low | 1765.89 |
| Daily Fibonacci 38.2% | 1926.39 |
| Daily Fibonacci 61.8% | 1920.68 |
| Daily Pivot Point S1 | 1916.60 |
| Daily Pivot Point S2 | 1901.94 |
| Daily Pivot Point S3 | 1892.43 |
| Daily Pivot Point R1 | 1940.77 |
| Daily Pivot Point R2 | 1950.28 |
| Daily Pivot Point R3 | 1964.94 |
[/s2If]
Join Our Telegram Group
")


