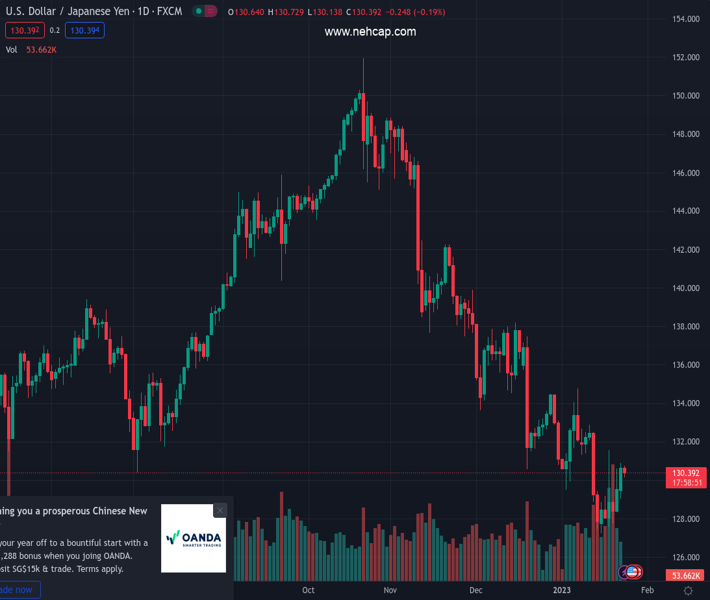
#USDJPY @ 130.380 A recovery in investors’ risk appetite has led to a correction in . (Pivot Orderbook analysis)
…
This is a premium post.
[s2If !current_user_can(access_s2member_level4)]Please register for PREMIUM VERSION HERE to read full post below containing analysis. In case of any error or you think you are not able to read the full post below, please email us at support#nehcap.com [lwa][/s2If] [s2If current_user_can(access_s2member_level4)]
- A recovery in investors’ risk appetite has led to a correction in USD/JPY.
- The volatility is contracting amid an Ascending Triangle formation.
- The 21-EMA is continuously providing support to the US Dollar.
The pair currently trades last at 130.380.
The previous day high was 130.89 while the previous day low was 129.04. The daily 38.2% Fib levels comes at 130.19, expected to provide support. Similarly, the daily 61.8% fib level is at 129.75, expected to provide support.
The USD/JPY pair has corrected gradually to near 130.15 after printing a fresh three-day high at 130.89 on Monday. The asset has corrected due to a recovery in investors’ risk-taking capacity. The risk-appetite theme has gained traction as the S&P500 futures have recovered losses recorded in early Asia. The major has remained volatile amid chatters over Bank of Japan (BOJ) Governor Haruhiko Kuroda’s successor.
The US Dollar Index (DXY) has slipped to near 101.50 after surrendering the critical support of 101.60. Losing traction for safe-haven assets has faded the risk aversion theme.
USD/JPY is demonstrating signs of volatility contraction amid the formation of the Ascending Triangle chart pattern on an hourly scale. The major is near the upward-sloping trendline of the chart pattern plotted from January 19 low at 127.76. While the horizontal resistance is placed from January 18 high around 131.58.
The 21-period Exponential Moving Average (EMA) at 130.35 is providing support to the US Dollar.
Meanwhile, the Relative Strength Index (RSI) (14) has slipped into the 40.00-60.00 range, portraying a loss in the upside momentum.
Should the asset break below Monday’s low around 129.00, Japanese Yen bulls will drag the asset towards January 19 low at 127.76 followed by January 16 low at 127.22.
On the contrary, a breakout of the chart pattern after exploding January 18 high around 131.58 will drive the asset towards January 9 high at 132.65. A break above the latter will expose the asset for more upside towards January 5 high around 134.00.
Technical Levels: Supports and Resistances
USDJPY currently trading at 130.38 at the time of writing. Pair opened at 130.69 and is trading with a change of -0.24 % .
| Overview | Overview.1 | |
|---|---|---|
| 0 | Today last price | 130.38 |
| 1 | Today Daily Change | -0.31 |
| 2 | Today Daily Change % | -0.24 |
| 3 | Today daily open | 130.69 |
The pair remains strongly bearish on the daily time frame. It trades below the 20 SMA @ 131.01, 50 SMA 134.62, 100 SMA @ 139.99 and 200 SMA @ 136.73.
| Trends | Trends.1 | |
|---|---|---|
| 0 | Daily SMA20 | 131.01 |
| 1 | Daily SMA50 | 134.62 |
| 2 | Daily SMA100 | 139.99 |
| 3 | Daily SMA200 | 136.73 |
The previous day high was 130.89 while the previous day low was 129.04. The daily 38.2% Fib levels comes at 130.19, expected to provide support. Similarly, the daily 61.8% fib level is at 129.75, expected to provide support.
Note the levels of interest below:
- Pivot support is noted at 129.53, 128.36, 127.68
- Pivot resistance is noted at 131.37, 132.06, 133.22
| Levels | Levels.1 |
|---|---|
| Previous Daily High | 130.89 |
| Previous Daily Low | 129.04 |
| Previous Weekly High | 131.58 |
| Previous Weekly Low | 127.22 |
| Previous Monthly High | 138.18 |
| Previous Monthly Low | 130.57 |
| Daily Fibonacci 38.2% | 130.19 |
| Daily Fibonacci 61.8% | 129.75 |
| Daily Pivot Point S1 | 129.53 |
| Daily Pivot Point S2 | 128.36 |
| Daily Pivot Point S3 | 127.68 |
| Daily Pivot Point R1 | 131.37 |
| Daily Pivot Point R2 | 132.06 |
| Daily Pivot Point R3 | 133.22 |
[/s2If]
Join Our Telegram Group
")


