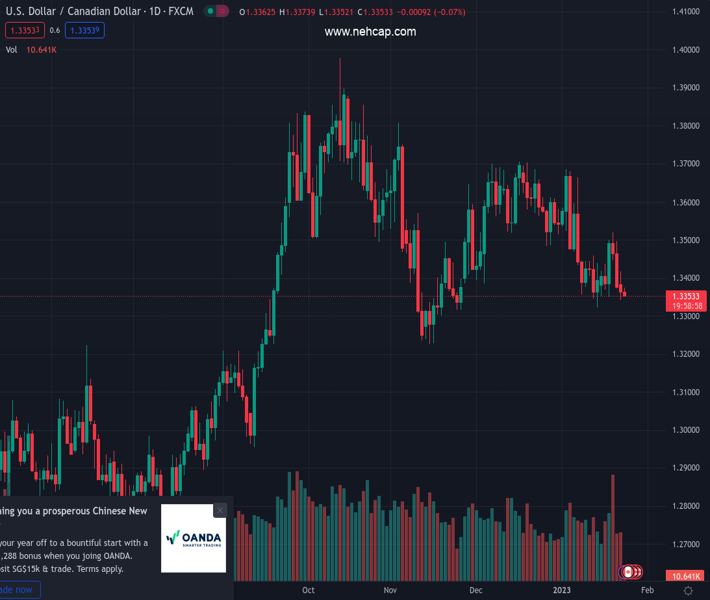
#USDCAD @ 1.33534 The Loonie asset has turned sideways as investors await BoC’s interest rate policy for fresh cues. (Pivot Orderbook analysis)
…
This is a premium post.
[s2If !current_user_can(access_s2member_level4)]Please register for PREMIUM VERSION HERE to read full post below containing analysis. In case of any error or you think you are not able to read the full post below, please email us at support#nehcap.com [lwa][/s2If] [s2If current_user_can(access_s2member_level4)]
- The Loonie asset has turned sideways as investors await BoC’s interest rate policy for fresh cues.
- Downward-sloping 20-and 50-EMAs indicate more weakness ahead.
- A bearish momentum will get triggered if RSI (14) drops into the bearish range of 20.00-40.00.
The pair currently trades last at 1.33534.
The previous day high was 1.3418 while the previous day low was 1.3342. The daily 38.2% Fib levels comes at 1.3371, expected to provide resistance. Similarly, the daily 61.8% fib level is at 1.3389, expected to provide resistance.
The USD/CAD pair is oscillating in a narrow range of 1.3362-1.3374 in the Asian session as investors are awaiting the announcement of the interest rate decision by the Bank of Canada (BoC) for fresh cues. The risk profile is demonstrating mixed signals, which might trigger volatility ahead.
S&P500 futures are showing losses in early Asia, failing to extend Monday’s bullish move further. The US Dollar Index (DXY) has extended its losses below 101.55 ahead of United States S&P PMI data. Meanwhile, the 10-year US Treasury yields have dropped to near 3.51%.
USD/CAD has dropped sharply to near the demand zone placed in a range of 1.3324-1.3359 on an hourly scale. The Lonnie asset witnessed a massive sell-off after surrendering the support of 1.3442. Downward-sloping 20-and 50-period Exponential Moving Averages (EMAs) at 1.3376 and 1.3397 respectively, add to the downside filters.
Meanwhile, the Relative Strength Index (RSI) (14) is oscillating in a 40.00-60.00 range. A breakdown of the RSI (14) into the bearish range of 20.00-40.00 will trigger the downside momentum.
Going forward, the Loonie asset will witness weakness if it drops below January 13 low at 1.3322. This will expose the asset for further weakness towards November 18 low at 1.3300 and November 15 low at 1.3226.
Alternatively, a break above January 12 high at 1.3461 will drive the asset towards the psychological resistance at 1.3500 followed by January 6 low at 1.3540.
Technical Levels: Supports and Resistances
USDCAD currently trading at 1.3363 at the time of writing. Pair opened at 1.3374 and is trading with a change of -0.08 % .
| Overview | Overview.1 | |
|---|---|---|
| 0 | Today last price | 1.3363 |
| 1 | Today Daily Change | -0.0011 |
| 2 | Today Daily Change % | -0.0800 |
| 3 | Today daily open | 1.3374 |
The pair is trading below its 20 Daily moving average @ 1.3474, below its 50 Daily moving average @ 1.3501 , below its 100 Daily moving average @ 1.3515 and above its 200 Daily moving average @ 1.3194
| Trends | Trends.1 | |
|---|---|---|
| 0 | Daily SMA20 | 1.3474 |
| 1 | Daily SMA50 | 1.3501 |
| 2 | Daily SMA100 | 1.3515 |
| 3 | Daily SMA200 | 1.3194 |
The previous day high was 1.3418 while the previous day low was 1.3342. The daily 38.2% Fib levels comes at 1.3371, expected to provide resistance. Similarly, the daily 61.8% fib level is at 1.3389, expected to provide resistance.
Note the levels of interest below:
- Pivot support is noted at 1.3338, 1.3302, 1.3262
- Pivot resistance is noted at 1.3414, 1.3453, 1.3489
| Levels | Levels.1 |
|---|---|
| Previous Daily High | 1.3418 |
| Previous Daily Low | 1.3342 |
| Previous Weekly High | 1.3521 |
| Previous Weekly Low | 1.3351 |
| Previous Monthly High | 1.3705 |
| Previous Monthly Low | 1.3385 |
| Daily Fibonacci 38.2% | 1.3371 |
| Daily Fibonacci 61.8% | 1.3389 |
| Daily Pivot Point S1 | 1.3338 |
| Daily Pivot Point S2 | 1.3302 |
| Daily Pivot Point S3 | 1.3262 |
| Daily Pivot Point R1 | 1.3414 |
| Daily Pivot Point R2 | 1.3453 |
| Daily Pivot Point R3 | 1.3489 |
[/s2If]
Join Our Telegram Group
")


