WTI retreats from multi-day high amid lack of major positives, cautious mood ahead of key data. (Pivot Orderbook analysis)
…
This is a premium post.
[s2If !current_user_can(access_s2member_level4)]Please register for PREMIUM VERSION HERE to read full post below containing analysis. In case of any error or you think you are not able to read the full post below, please email us at support#nehcap.com [lwa][/s2If] [s2If current_user_can(access_s2member_level4)]
- WTI retreats from multi-day high amid lack of major positives, cautious mood ahead of key data.
- Sluggish markets, Lunar New Year in China limit energy buyers’ optimism.
- Preliminary PMIs for January, weekly oil inventory data from API could direct intraday moves.
The pair currently trades last at 81.69.
The previous day high was 81.93 while the previous day low was 79.94. The daily 38.2% Fib levels comes at 81.17, expected to provide support. Similarly, the daily 61.8% fib level is at 80.7, expected to provide support.
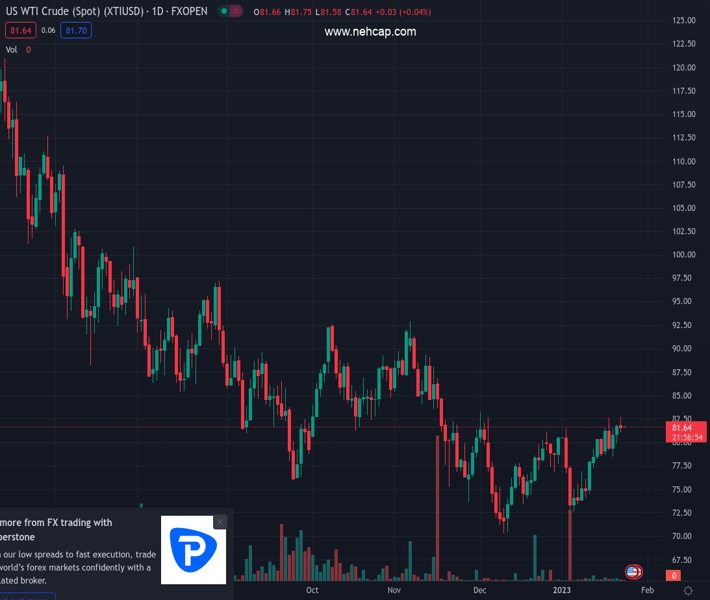
WTI crude oil remains sidelined around $81.70, after refreshing the multi-day high above $82.00 the previous day. In doing so, the black gold portrays the market’s inaction amid an absence of Chinese players due to the Lunar New year (LNY) holidays. Adding strength to the Oil price inaction could be the cautious mood ahead of the preliminary readings of January’s activity numbers from the key economies.
That said, the broad US Dollar weakness and easing recession fears, mainly backed by China-linked optimism, seemed to have propelled the WTI crude oil to $82.68, the highest level since December 05, 2022.
Adding strength to the energy market’s positive outlook could be the news suggesting a five-month high in India’s crude oil imports and Pakistan’s readiness to push back the power shortage with international help. It should be noted that the hopes of improved festive demand from China also propels the WTI crude oil prices of late.
Furthermore, the European Union and Group of Seven (G7) coalition’s price cap on Russian Oil exports also adds strength to the energy benchmark.
Alternatively, hawkish comments from the major central banks, despite chatters of policy normalization, join the talks of more output from the key suppliers to probe the WTI crude oil buyers.
Looking forward, the first readings of January’s activity data for Germany, the Eurozone and the US will be crucial for immediate directions. Additionally, the weekly oil inventory data from the industry player American Petroleum Institute (API), prior 7.615M, will also be important for the commodity’s immediate direction.
Monday’s Doji candlestick on the Daily chart challenges Oil buyers unless the quote offers a daily closing beyond the 100-DMA, close to $81.75 by the press time.
Technical Levels: Supports and Resistances
XTIUSD currently trading at 81.69 at the time of writing. Pair opened at 81.87 and is trading with a change of -0.22% % .
| Overview | Overview.1 | |
|---|---|---|
| 0 | Today last price | 81.69 |
| 1 | Today Daily Change | -0.18 |
| 2 | Today Daily Change % | -0.22% |
| 3 | Today daily open | 81.87 |
The pair is trading above its 20 Daily moving average @ 78.26, above its 50 Daily moving average @ 78.12 , below its 100 Daily moving average @ 81.83 and below its 200 Daily moving average @ 91.97
| Trends | Trends.1 | |
|---|---|---|
| 0 | Daily SMA20 | 78.26 |
| 1 | Daily SMA50 | 78.12 |
| 2 | Daily SMA100 | 81.83 |
| 3 | Daily SMA200 | 91.97 |
The previous day high was 81.93 while the previous day low was 79.94. The daily 38.2% Fib levels comes at 81.17, expected to provide support. Similarly, the daily 61.8% fib level is at 80.7, expected to provide support.
Note the levels of interest below:
- Pivot support is noted at 80.57, 79.26, 78.58
- Pivot resistance is noted at 82.55, 83.24, 84.54
| Levels | Levels.1 |
|---|---|
| Previous Daily High | 81.93 |
| Previous Daily Low | 79.94 |
| Previous Weekly High | 82.67 |
| Previous Weekly Low | 78.48 |
| Previous Monthly High | 83.30 |
| Previous Monthly Low | 70.27 |
| Daily Fibonacci 38.2% | 81.17 |
| Daily Fibonacci 61.8% | 80.70 |
| Daily Pivot Point S1 | 80.57 |
| Daily Pivot Point S2 | 79.26 |
| Daily Pivot Point S3 | 78.58 |
| Daily Pivot Point R1 | 82.55 |
| Daily Pivot Point R2 | 83.24 |
| Daily Pivot Point R3 | 84.54 |
[/s2If]
Join Our Telegram Group
")


