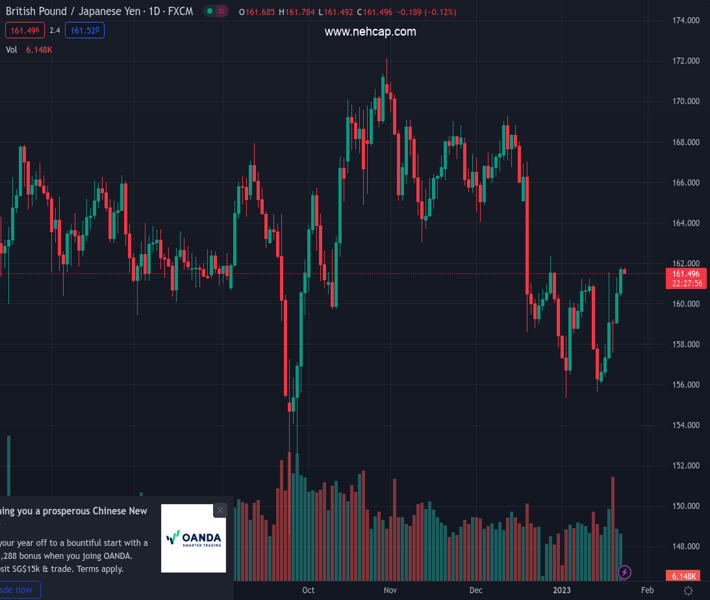
#GBPJPY @ 161.506 The reached a 4-week high at 161.80, eyeing the confluence of the 50 and 200-day EMAs. (Pivot Orderbook analysis)
…
This is a premium post.
[s2If !current_user_can(access_s2member_level4)]Please register for PREMIUM VERSION HERE to read full post below containing analysis. In case of any error or you think you are not able to read the full post below, please email us at support#nehcap.com [lwa][/s2If] [s2If current_user_can(access_s2member_level4)]
- The GBP/JPY reached a 4-week high at 161.80, eyeing the confluence of the 50 and 200-day EMAs.
- GBP/JPY Price Analysis: Double bottom looms, but a death-cross looming suggests further downside is expected.
The pair currently trades last at 161.506.
The previous day high was 161.29 while the previous day low was 159.04. The daily 38.2% Fib levels comes at 160.43, expected to provide support. Similarly, the daily 61.8% fib level is at 159.9, expected to provide support.
The GBP/JPY extended its gains for two straight days and climbed towards a wall of resistance, with the confluence of the 50 and 200-day Exponential Moving Averages (EMAs) around 161.90-162.20. As the Asian Pacific session begins, the GBP/JPY is trading at 161.61, below its opening price by 0.05%.
After reaching a daily high of 161.80, the GBP/JPY fell short of reclaiming the 50-day EMA at 161.87. even though buyers reclaimed the 161.00 figure and cleared last Friday’s high of 161.2, the GBP/JPY aims upwards, though it would face solid resistance ahead.
The GBP/JPY key resistance levels lie at the 50-day EMA at 161.87. A breach of the latter would expose 162.00, followed by the 200-day EMA at 162.18, followed by the 100-day EMA at 162.87.
As an alternative scenario, if the GBP/JPY reverses Monday’s price action, its first support would be the 161.00 figure. Break below will expose the 20-day EMA at 160.04, followed by the January 23 swing low of 159.00.
Technical Levels: Supports and Resistances
GBPJPY currently trading at 161.62 at the time of writing. Pair opened at 160.62 and is trading with a change of 0.62 % .
| Overview | Overview.1 | |
|---|---|---|
| 0 | Today last price | 161.62 |
| 1 | Today Daily Change | 1.00 |
| 2 | Today Daily Change % | 0.62 |
| 3 | Today daily open | 160.62 |
The pair is trading above its 20 Daily moving average @ 159.19, below its 50 Daily moving average @ 163.22 , below its 100 Daily moving average @ 164.02 and below its 200 Daily moving average @ 163.51
| Trends | Trends.1 | |
|---|---|---|
| 0 | Daily SMA20 | 159.19 |
| 1 | Daily SMA50 | 163.22 |
| 2 | Daily SMA100 | 164.02 |
| 3 | Daily SMA200 | 163.51 |
The previous day high was 161.29 while the previous day low was 159.04. The daily 38.2% Fib levels comes at 160.43, expected to provide support. Similarly, the daily 61.8% fib level is at 159.9, expected to provide support.
Note the levels of interest below:
- Pivot support is noted at 159.35, 158.07, 157.1
- Pivot resistance is noted at 161.6, 162.57, 163.84
| Levels | Levels.1 |
|---|---|
| Previous Daily High | 161.29 |
| Previous Daily Low | 159.04 |
| Previous Weekly High | 161.54 |
| Previous Weekly Low | 156.06 |
| Previous Monthly High | 169.28 |
| Previous Monthly Low | 157.84 |
| Daily Fibonacci 38.2% | 160.43 |
| Daily Fibonacci 61.8% | 159.90 |
| Daily Pivot Point S1 | 159.35 |
| Daily Pivot Point S2 | 158.07 |
| Daily Pivot Point S3 | 157.10 |
| Daily Pivot Point R1 | 161.60 |
| Daily Pivot Point R2 | 162.57 |
| Daily Pivot Point R3 | 163.84 |
[/s2If]
Join Our Telegram Group
")


