#USDJPY @ 130.578 The post gains for two straight days and meanders around the 20-day EMA. (Pivot Orderbook analysis)
…
This is a premium post.
[s2If !current_user_can(access_s2member_level4)]Please register for PREMIUM VERSION HERE to read full post below containing analysis. In case of any error or you think you are not able to read the full post below, please email us at support#nehcap.com [lwa][/s2If] [s2If current_user_can(access_s2member_level4)]
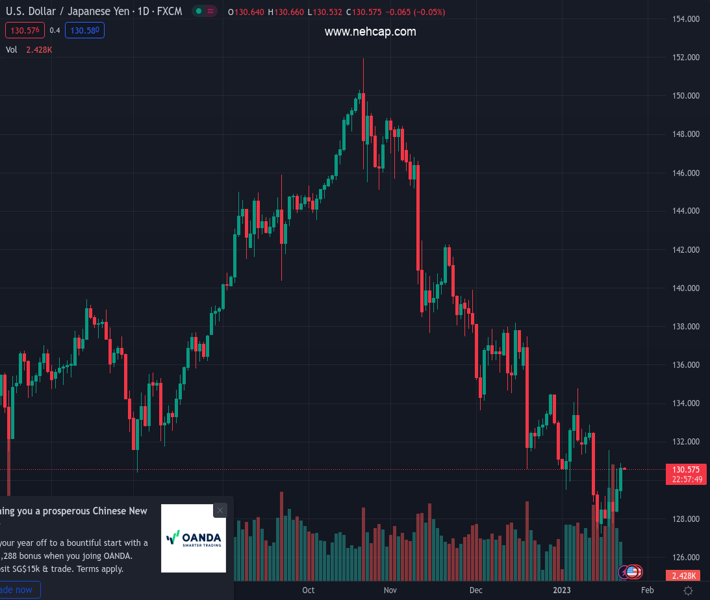
- The USD/JPY post gains for two straight days and meanders around the 20-day EMA.
- USD/JPY Price Analysis: Range-bound capped around the 130.00-131.00 mark.
The pair currently trades last at 130.578.
The previous day high was 130.61 while the previous day low was 128.35. The daily 38.2% Fib levels comes at 129.75, expected to provide support. Similarly, the daily 61.8% fib level is at 129.21, expected to provide support.
The USD/JPY prolonged its gains to two consecutive days on Monday, though it faltered to crack the 20-day Exponential Moving Average (EMA) at 130.91, which would pave the way for further upside. Nevertheless, as the Asian session begins, the USD/JPY is trading at 130.60, registering minuscule losses of 0.02%.
The USD/JPY tested the 20-day EMA during Monday’s session, though the pair retreated and closed at 130.64. However, the USD/JPY pair remains tilted to the downside, but it might consolidate around 131.00. This is because the Relative Strength Index (RSI), albeit at bearish territory, is almost flat, while the Rate of Change (RoC) portrays buyers gathering momentum.
For the USD/JPY to resume upwards in the near term, it needs to break January’s 18-daily high of 131.57. Break above will expose the 132.00 mark, followed by a falling slope resistance trendline around 132.18, followed by the 50-day EMA at 134.10. As an alternate scenario, if the downtrend resumes, the USD/JPY first support would be the January 23 daily low of 129.04, followed by January 16 at 127.21.
Technical Levels: Supports and Resistances
USDJPY currently trading at 130.61 at the time of writing. Pair opened at 129.58 and is trading with a change of 0.79 % .
| Overview | Overview.1 | |
|---|---|---|
| 0 | Today last price | 130.61 |
| 1 | Today Daily Change | 1.03 |
| 2 | Today Daily Change % | 0.79 |
| 3 | Today daily open | 129.58 |
The pair remains strongly bearish on the daily time frame. It trades below the 20 SMA @ 131.12, 50 SMA 134.8, 100 SMA @ 140.09 and 200 SMA @ 136.71.
| Trends | Trends.1 | |
|---|---|---|
| 0 | Daily SMA20 | 131.12 |
| 1 | Daily SMA50 | 134.80 |
| 2 | Daily SMA100 | 140.09 |
| 3 | Daily SMA200 | 136.71 |
The previous day high was 130.61 while the previous day low was 128.35. The daily 38.2% Fib levels comes at 129.75, expected to provide support. Similarly, the daily 61.8% fib level is at 129.21, expected to provide support.
Note the levels of interest below:
- Pivot support is noted at 128.42, 127.25, 126.15
- Pivot resistance is noted at 130.68, 131.78, 132.95
| Levels | Levels.1 |
|---|---|
| Previous Daily High | 130.61 |
| Previous Daily Low | 128.35 |
| Previous Weekly High | 131.58 |
| Previous Weekly Low | 127.22 |
| Previous Monthly High | 138.18 |
| Previous Monthly Low | 130.57 |
| Daily Fibonacci 38.2% | 129.75 |
| Daily Fibonacci 61.8% | 129.21 |
| Daily Pivot Point S1 | 128.42 |
| Daily Pivot Point S2 | 127.25 |
| Daily Pivot Point S3 | 126.15 |
| Daily Pivot Point R1 | 130.68 |
| Daily Pivot Point R2 | 131.78 |
| Daily Pivot Point R3 | 132.95 |
[/s2If]
Join Our Telegram Group
")


