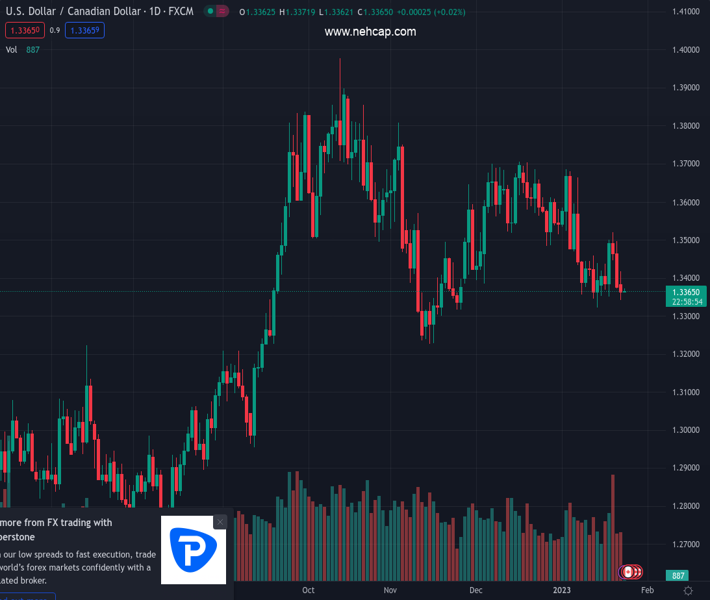
#USDCAD @ 1.33683 is looking to extend its downside towards a weekly low around 1.3340 amid the risk-on market mood. (Pivot Orderbook analysis)
…
This is a premium post.
[s2If !current_user_can(access_s2member_level4)]Please register for PREMIUM VERSION HERE to read full post below containing analysis. In case of any error or you think you are not able to read the full post below, please email us at support#nehcap.com [lwa][/s2If] [s2If current_user_can(access_s2member_level4)]
- USD/CAD is looking to extend its downside towards a weekly low around 1.3340 amid the risk-on market mood.
- The BoC is expected to hike interest rates further by 25 bps to 4.50% this week.
- Oil prices might deliver a recovery amid optimism over China’s economic recovery.
The pair currently trades last at 1.33683.
The previous day high was 1.3498 while the previous day low was 1.3378. The daily 38.2% Fib levels comes at 1.3423, expected to provide resistance. Similarly, the daily 61.8% fib level is at 1.3452, expected to provide resistance.
The USD/CAD pair has dropped to near 1.3367 gradually in early Asia after failing to shift its auction above the round-level resistance of 1.3400. The Loonie asset is expected to stretch its downside journey to near the weekly low around 1.3340 as the risk-taking capacity of the market participants has improved.
The risk appetite theme solidified amid easing recession fears in the United States on expectations of a smaller interest rate hike by the Federal Reserve (Fed) next week. S&P500 witnessed a decent buying interest on Monday, supported by a recovery in tech-savvy stocks. Meanwhile, fading risk aversion among the market participants could propel further sell-off in the US Dollar Index (DXY).
The USD Index is hovering near the lower end of its trading range in the 101.56-101.87 territory. The alpha generated by the US government bonds is still solid as terminal rate projections have not trimmed despite continuous inflation softening. The 10-year US Treasury yields have extended above 3.52%
On the Loonie front, investors are awaiting the announcement of the interest rate decision by the Bank of Canada (BoC), which is scheduled for Wednesday, for fresh cues. Canada’s inflation is declining gradually and has dropped to 6.3% but is still beyond the 2% inflation target, therefore expectations of a further hike in the interest rates cannot be ruled out.
According to a poll from Reuters, BoC Governor Tiff Macklem’s aggressive policy tightening campaign is expected to calm further as the street sees a further interest rate hike by 25 basis points (bps) to 4.50%. On the oil front, the oil price has witnessed selling pressure after failing to overstep previous week’s high at $82.50. The upside bias is still solid as China’s economic recovery is expected to keep oil demand at elevated levels. It is worth noting that Canada is a leading exporter of oil to the United States and the higher oil price will provide support to the Canadian Dollar.
Technical Levels: Supports and Resistances
USDCAD currently trading at 1.3372 at the time of writing. Pair opened at 1.3381 and is trading with a change of -0.07 % .
| Overview | Overview.1 | |
|---|---|---|
| 0 | Today last price | 1.3372 |
| 1 | Today Daily Change | -0.0009 |
| 2 | Today Daily Change % | -0.0700 |
| 3 | Today daily open | 1.3381 |
The pair is trading below its 20 Daily moving average @ 1.3486, below its 50 Daily moving average @ 1.35 , below its 100 Daily moving average @ 1.3513 and above its 200 Daily moving average @ 1.319
| Trends | Trends.1 | |
|---|---|---|
| 0 | Daily SMA20 | 1.3486 |
| 1 | Daily SMA50 | 1.3500 |
| 2 | Daily SMA100 | 1.3513 |
| 3 | Daily SMA200 | 1.3190 |
The previous day high was 1.3498 while the previous day low was 1.3378. The daily 38.2% Fib levels comes at 1.3423, expected to provide resistance. Similarly, the daily 61.8% fib level is at 1.3452, expected to provide resistance.
Note the levels of interest below:
- Pivot support is noted at 1.334, 1.3299, 1.322
- Pivot resistance is noted at 1.346, 1.3539, 1.358
| Levels | Levels.1 |
|---|---|
| Previous Daily High | 1.3498 |
| Previous Daily Low | 1.3378 |
| Previous Weekly High | 1.3521 |
| Previous Weekly Low | 1.3351 |
| Previous Monthly High | 1.3705 |
| Previous Monthly Low | 1.3385 |
| Daily Fibonacci 38.2% | 1.3423 |
| Daily Fibonacci 61.8% | 1.3452 |
| Daily Pivot Point S1 | 1.3340 |
| Daily Pivot Point S2 | 1.3299 |
| Daily Pivot Point S3 | 1.3220 |
| Daily Pivot Point R1 | 1.3460 |
| Daily Pivot Point R2 | 1.3539 |
| Daily Pivot Point R3 | 1.3580 |
[/s2If]
Join Our Telegram Group
")


