#AUDUSD @ 0.70252 A higher-than-expected Consumer Price Index (CPI) in Australia could offer a chance to break above 0.7100. (Pivot Orderbook analysis)
…
This is a premium post.
[s2If !current_user_can(access_s2member_level4)]Please register for PREMIUM VERSION HERE to read full post below containing analysis. In case of any error or you think you are not able to read the full post below, please email us at support#nehcap.com [lwa][/s2If] [s2If current_user_can(access_s2member_level4)]
- A higher-than-expected Consumer Price Index (CPI) in Australia could offer a chance to break above 0.7100.
- The US calendar will feature S&P Global PMIs on Tuesday and GDP on Wednesday.
- AUD/USD: Failure to gain traction above 0.7050 will expose the pair to sellers; otherwise, a 0.7100 test is on the cards.
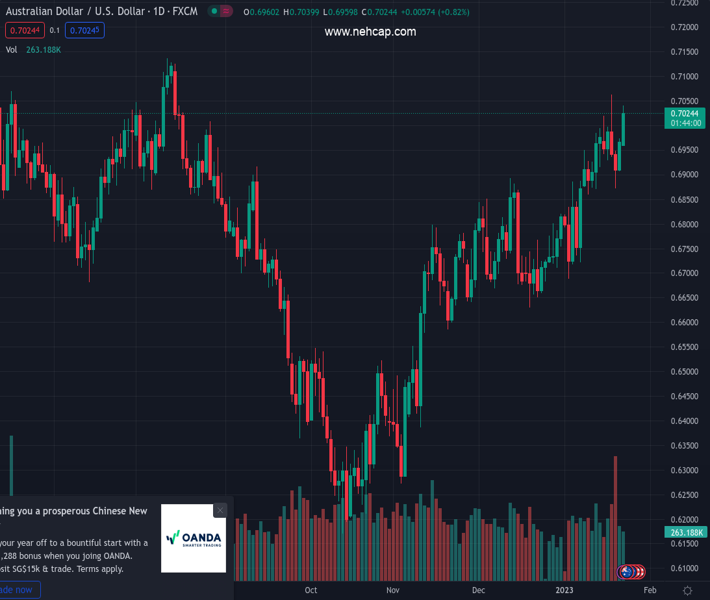
The pair currently trades last at 0.70252.
The previous day high was 0.6974 while the previous day low was 0.6906. The daily 38.2% Fib levels comes at 0.6948, expected to provide support. Similarly, the daily 61.8% fib level is at 0.6932, expected to provide support.
The Australian Dollar (AUD) climbs sharply against the US Dollar (USD) even though the greenback is positing minimal gains, spurred by risk appetite improvement. Also, Australia’s inflation report on Wednesday could trigger a reaction by the Reserve Bank of Australia (RBA). At the time of writing, the AUD/USD is trading at 0.7025.
The AUD/USD has extended us gains, though slightly capped by the buck. The US Dollar Index (DXY), a gauge of the buck’s value against six peers, is gaining 0.13%, at 102.124, underpinned by US Treasury bond yields rising. The 10-year benchmark note rate advances three and a half bps at 3.521%.
Following the Wall Street opening, the Conference Board (CB) reported its Leading Economic Index (LEI), which dropped for the tenth month in December. The US LEI fell sharply again in December—continuing to signal recession for the US economy in the near term,” said Ataman Ozyildirim, Senior Director, Economics, at The Conference Board. “There was widespread weakness among leading indicators in December, indicating deteriorating conditions for labor markets, manufacturing, housing construction, and financial markets in the months ahead.”
In the meantime, money market futures expect the Federal Reserve (Fed) to hike the 25 bps rate hikes at the February 1 meeting, leaving the Federal Funds rate (FFR) at 4.50-4.75%.
Elsewhere, the Reserve Bank of Australia (RBA) is expected to hike rates by 25 bps, the cash rate on February 7 to 3.35%. Markets had priced in an 80% chance for the RBA lifting rates, and the cash rate is seeing peaking at 3.55%-3.60%.
In the meantime, Wednesday’s release of the Australian Consumer Price Index (CPI) for the fourth quarter is expected to rise 1.5% QoQ and 7.4% YoY. According to Westpac analysts, that should be the cycle peak for inflation. A softer reading would send the AUD/USD diving below 0.7000; otherwise, it could open the door for further upside and test the 0.7100 mark.
On the US front, its calendar will feature the S&P Global PMIs, ahead of Wednesday’s Gross Domestic Product (GDP) for the fourth quarter and the entire year of 2022.
Although the AUD/USD extended its gains above the 0.7000 figure, the YTD high of 0.7063 remains intact, with sellers stepping in around the 0.7050 area and lowering prices. Failure to gain traction above 0.7063 has kept the AUD/USD from testing the August 11 swing high of 0.7136 and sent the pair diving beneath the 0.7000 mark. Break below the latter would expose the 20-day Exponential Moving Average (EMA) at 0.6889.
Technical Levels: Supports and Resistances
AUDUSD currently trading at 0.7021 at the time of writing. Pair opened at 0.697 and is trading with a change of 0.73 % .
| Overview | Overview.1 | |
|---|---|---|
| 0 | Today last price | 0.7021 |
| 1 | Today Daily Change | 0.0051 |
| 2 | Today Daily Change % | 0.7300 |
| 3 | Today daily open | 0.6970 |
The pair remains strongly bullish on the daily timeframe. It trades above its 20 SMA @ 0.6859, 50 SMA 0.678, 100 SMA @ 0.6641 and 200 SMA @ 0.6819.
| Trends | Trends.1 | |
|---|---|---|
| 0 | Daily SMA20 | 0.6859 |
| 1 | Daily SMA50 | 0.6780 |
| 2 | Daily SMA100 | 0.6641 |
| 3 | Daily SMA200 | 0.6819 |
The previous day high was 0.6974 while the previous day low was 0.6906. The daily 38.2% Fib levels comes at 0.6948, expected to provide support. Similarly, the daily 61.8% fib level is at 0.6932, expected to provide support.
Note the levels of interest below:
- Pivot support is noted at 0.6926, 0.6883, 0.6859
- Pivot resistance is noted at 0.6994, 0.7017, 0.7061
| Levels | Levels.1 |
|---|---|
| Previous Daily High | 0.6974 |
| Previous Daily Low | 0.6906 |
| Previous Weekly High | 0.7064 |
| Previous Weekly Low | 0.6872 |
| Previous Monthly High | 0.6893 |
| Previous Monthly Low | 0.6629 |
| Daily Fibonacci 38.2% | 0.6948 |
| Daily Fibonacci 61.8% | 0.6932 |
| Daily Pivot Point S1 | 0.6926 |
| Daily Pivot Point S2 | 0.6883 |
| Daily Pivot Point S3 | 0.6859 |
| Daily Pivot Point R1 | 0.6994 |
| Daily Pivot Point R2 | 0.7017 |
| Daily Pivot Point R3 | 0.7061 |
[/s2If]
Join Our Telegram Group
")


