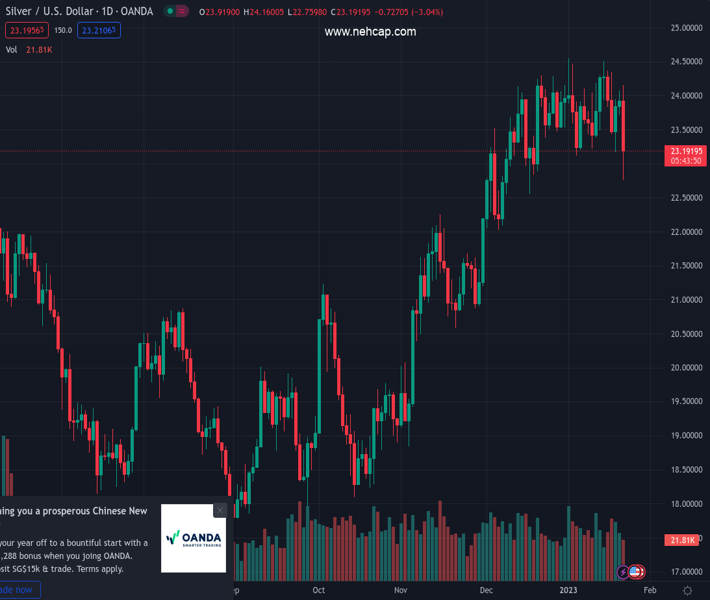
#XAGUSD @ 23.213 suffers the worst daily decline in months. (Pivot Orderbook analysis)
…
This is a premium post.
[s2If !current_user_can(access_s2member_level4)]Please register for PREMIUM VERSION HERE to read full post below containing analysis. In case of any error or you think you are not able to read the full post below, please email us at support#nehcap.com [lwa][/s2If] [s2If current_user_can(access_s2member_level4)]
- XAG/USD suffers the worst daily decline in months.
- Price hits the lowest level in five weeks, under pressure after losing key support levels.
- Gold remains steady, US stocks rise.
The pair currently trades last at 23.213.
The previous day high was 24.08 while the previous day low was 23.71. The daily 38.2% Fib levels comes at 23.94, expected to provide resistance. Similarly, the daily 61.8% fib level is at 23.85, expected to provide resistance.
Silver price is falling sharply on Monday, even as the US Dollar holds relatively steady and despite rising equity prices. XAG/USD recently hit a fresh one-month low at $22.73 before rebounding toward $23.00.
During the Asian session, silver hit a five-day high at $24.15 but It failed to hold above $24.00. After moving sideways during most of the European session, XAG/USD broke the $23.60 support area, and tumbled, also losing the $23.10/20 zone.
At some point of the day, silver was losing more than 5% before trimming some losses. The sharp decline takes place even as gold trades practically flat for the day and even as Wall Street rises. The Dow Jones is up by 0.80% and the S&P 500 gains 1.05%.
The technical outlook has deteriorated significantly for XAG/USD. The 20-day Simple Moving Average, today at $23.70 is starting to turn south. The next strong support emerges at $22.50.
A recovery back above $23.20 would alleviate the bearish pressure. A daily close well above $24.10 should open the doors to more gains over the medium term.
Technical Levels: Supports and Resistances
XAGUSD currently trading at 22.93 at the time of writing. Pair opened at 23.94 and is trading with a change of -4.22 % .
| Overview | Overview.1 | |
|---|---|---|
| 0 | Today last price | 22.93 |
| 1 | Today Daily Change | -1.01 |
| 2 | Today Daily Change % | -4.22 |
| 3 | Today daily open | 23.94 |
The pair is trading below its 20 Daily moving average @ 23.8, below its 50 Daily moving average @ 22.98 , above its 100 Daily moving average @ 21.23 and above its 200 Daily moving average @ 21.04
| Trends | Trends.1 | |
|---|---|---|
| 0 | Daily SMA20 | 23.80 |
| 1 | Daily SMA50 | 22.98 |
| 2 | Daily SMA100 | 21.23 |
| 3 | Daily SMA200 | 21.04 |
The previous day high was 24.08 while the previous day low was 23.71. The daily 38.2% Fib levels comes at 23.94, expected to provide resistance. Similarly, the daily 61.8% fib level is at 23.85, expected to provide resistance.
Note the levels of interest below:
- Pivot support is noted at 23.74, 23.54, 23.36
- Pivot resistance is noted at 24.11, 24.28, 24.48
| Levels | Levels.1 |
|---|---|
| Previous Daily High | 24.08 |
| Previous Daily Low | 23.71 |
| Previous Weekly High | 24.51 |
| Previous Weekly Low | 23.17 |
| Previous Monthly High | 24.30 |
| Previous Monthly Low | 22.03 |
| Daily Fibonacci 38.2% | 23.94 |
| Daily Fibonacci 61.8% | 23.85 |
| Daily Pivot Point S1 | 23.74 |
| Daily Pivot Point S2 | 23.54 |
| Daily Pivot Point S3 | 23.36 |
| Daily Pivot Point R1 | 24.11 |
| Daily Pivot Point R2 | 24.28 |
| Daily Pivot Point R3 | 24.48 |
[/s2If]
Join Our Telegram Group
")


