#XAUUSD @ 1,918.43 Gold price drops more than 0.60% on Monday amidst upbeat market sentiment (Pivot Orderbook analysis)
…
This is a premium post.
[s2If !current_user_can(access_s2member_level4)]Please register for PREMIUM VERSION HERE to read full post below containing analysis. In case of any error or you think you are not able to read the full post below, please email us at support#nehcap.com [lwa][/s2If] [s2If current_user_can(access_s2member_level4)]
- Gold price drops more than 0.60% on Monday amidst upbeat market sentiment
- Elevated US Treasury bond yields underpinning the US Dollar, a headwind for XAU/USD.
- Gold Price Forecast: Bulls take a respite but break below $1900, which could expose the 20-day EMA.
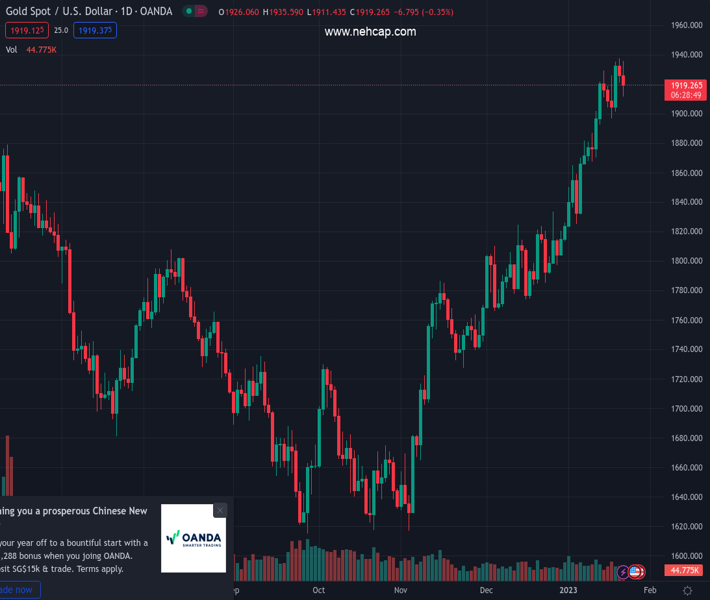
The pair currently trades last at 1918.43.
The previous day high was 1937.57 while the previous day low was 1920.71. The daily 38.2% Fib levels comes at 1927.15, expected to provide resistance. Similarly, the daily 61.8% fib level is at 1931.13, expected to provide resistance.
Gold price retraces from around daily highs hit at $1935.51 and drops beneath $1915 as US Treasury bond yields recover some ground and underpin the US Dollar (USD), although market sentiment remains upbeat. Therefore, the yellow metal remains lackluster, and the XAU/USD exchanges hands at around $1914.49, down by more than 0.60%.
Factors like US Treasury bond yields advancing, particularly the 10-year benchmark note rate up three and a half bps, at 3.517%, is weighing on Gold prices. Consequently, the greenback edges up 0.16%, as shown by the US Dollar Index, a measure of the buck’s value against a basket of peers, trading at 102.142, a headwind for XAU/USD.
Risk appetite improved, as shown by US equities opening in green territory bolstered by the lack of Fed officials speaking, due to the blackout period, ahead of the Federal Reserve’s Open Market Committee (FOMC) meeting on January 31 – February 1.
Sources cited by Reuters commented that “Gold still looking well supported despite the pullback from last week’s peaks, and currently has support at $1,896 and could well gain further momentum once next week’s central bank meetings are out of the way.”
Elsewhere, a slew of Fed policymakers expressed their support for gradual interest rate hikes during the last week, though they emphasized that rates would not be cut in 2023 and would remain higher for longer.
Data-wise, the US economic calendar would unveil the Gross Domestic Product (GDP) results for the fourth quarter in the United States (US), with estimates of around 2.6% QoQ. Additionally, Flash PMIs, Unemployment Claims, Durable Good Orders, and the Fed’s favorite gauge for inflation, Personal Consumption Expenditures (PCE), would provide fresh impetus to Gold traders.
Technically, the XAU/USD continues to be upward biased, though failure to crack last week’s nine-month high at $1937.51 exacerbated its fall beneath the $1915 mark. Gold bulls should be aware that any break below $1900 could put into play January’s 18 daily low of $1896.76, which, once cleared, that would expose the 20-day Exponential Moving Average (EMA) at $1877.31.
Technical Levels: Supports and Resistances
XAUUSD currently trading at 1914.21 at the time of writing. Pair opened at 1927.24 and is trading with a change of -0.68 % .
| Overview | Overview.1 | |
|---|---|---|
| 0 | Today last price | 1914.21 |
| 1 | Today Daily Change | -13.03 |
| 2 | Today Daily Change % | -0.68 |
| 3 | Today daily open | 1927.24 |
The pair remains strongly bullish on the daily timeframe. It trades above its 20 SMA @ 1865.17, 50 SMA 1812.5, 100 SMA @ 1744.14 and 200 SMA @ 1775.96.
| Trends | Trends.1 | |
|---|---|---|
| 0 | Daily SMA20 | 1865.17 |
| 1 | Daily SMA50 | 1812.50 |
| 2 | Daily SMA100 | 1744.14 |
| 3 | Daily SMA200 | 1775.96 |
The previous day high was 1937.57 while the previous day low was 1920.71. The daily 38.2% Fib levels comes at 1927.15, expected to provide resistance. Similarly, the daily 61.8% fib level is at 1931.13, expected to provide resistance.
Note the levels of interest below:
- Pivot support is noted at 1919.44, 1911.65, 1902.58
- Pivot resistance is noted at 1936.3, 1945.37, 1953.16
| Levels | Levels.1 |
|---|---|
| Previous Daily High | 1937.57 |
| Previous Daily Low | 1920.71 |
| Previous Weekly High | 1937.57 |
| Previous Weekly Low | 1896.63 |
| Previous Monthly High | 1833.38 |
| Previous Monthly Low | 1765.89 |
| Daily Fibonacci 38.2% | 1927.15 |
| Daily Fibonacci 61.8% | 1931.13 |
| Daily Pivot Point S1 | 1919.44 |
| Daily Pivot Point S2 | 1911.65 |
| Daily Pivot Point S3 | 1902.58 |
| Daily Pivot Point R1 | 1936.30 |
| Daily Pivot Point R2 | 1945.37 |
| Daily Pivot Point R3 | 1953.16 |
[/s2If]
Join Our Telegram Group
")


