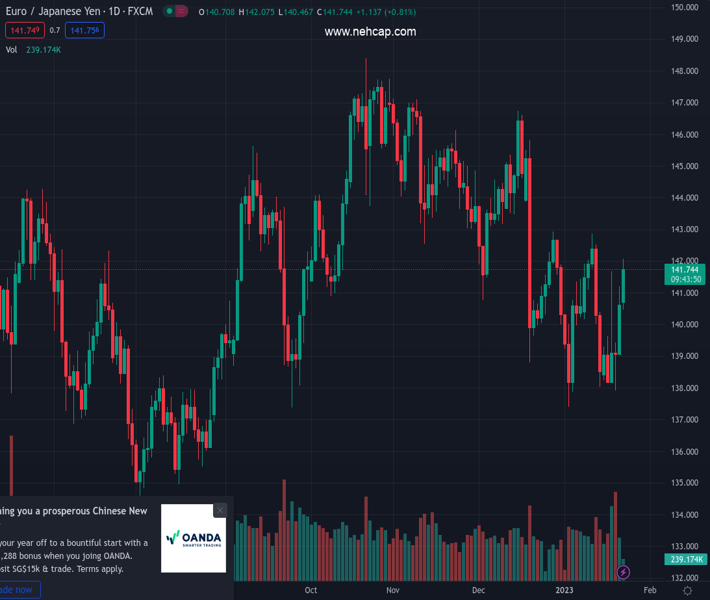
#EURJPY @ 141.737 climbs further and retakes the 142.00 mark. (Pivot Orderbook analysis)
…
This is a premium post.
[s2If !current_user_can(access_s2member_level4)]Please register for PREMIUM VERSION HERE to read full post below containing analysis. In case of any error or you think you are not able to read the full post below, please email us at support#nehcap.com [lwa][/s2If] [s2If current_user_can(access_s2member_level4)]
- EUR/JPY climbs further and retakes the 142.00 mark.
- Further gains could see the resistance area around 143.00 revisited.
The pair currently trades last at 141.737.
The previous day high was 141.2 while the previous day low was 138.91. The daily 38.2% Fib levels comes at 140.32, expected to provide support. Similarly, the daily 61.8% fib level is at 139.78, expected to provide support.
EUR/JPY adds to Friday’s strong bounce and leaves behind the key 142.00 hurdle at the beginning of the week.
A sustainable breakout of the 200-day SMA, today at 140.76, should shift the outlook to a more constructive one and open the door to a probable visit to the key resistance area near 143.00 in the short-term horizon (high December 28, January 11).
On the downside, there is an initial contention around the 138.00 zone for the time being.
Technical Levels: Supports and Resistances
EURJPY currently trading at 141.69 at the time of writing. Pair opened at 140.68 and is trading with a change of 0.72 % .
| Overview | Overview.1 | |
|---|---|---|
| 0 | Today last price | 141.69 |
| 1 | Today Daily Change | 161.00 |
| 2 | Today Daily Change % | 0.72 |
| 3 | Today daily open | 140.68 |
The pair is trading above its 20 Daily moving average @ 140.43, below its 50 Daily moving average @ 142.44 , below its 100 Daily moving average @ 143.14 and above its 200 Daily moving average @ 140.78
| Trends | Trends.1 | |
|---|---|---|
| 0 | Daily SMA20 | 140.43 |
| 1 | Daily SMA50 | 142.44 |
| 2 | Daily SMA100 | 143.14 |
| 3 | Daily SMA200 | 140.78 |
The previous day high was 141.2 while the previous day low was 138.91. The daily 38.2% Fib levels comes at 140.32, expected to provide support. Similarly, the daily 61.8% fib level is at 139.78, expected to provide support.
Note the levels of interest below:
- Pivot support is noted at 139.33, 137.97, 137.04
- Pivot resistance is noted at 141.62, 142.56, 143.91
| Levels | Levels.1 |
|---|---|
| Previous Daily High | 141.20 |
| Previous Daily Low | 138.91 |
| Previous Weekly High | 141.69 |
| Previous Weekly Low | 137.92 |
| Previous Monthly High | 146.73 |
| Previous Monthly Low | 138.80 |
| Daily Fibonacci 38.2% | 140.32 |
| Daily Fibonacci 61.8% | 139.78 |
| Daily Pivot Point S1 | 139.33 |
| Daily Pivot Point S2 | 137.97 |
| Daily Pivot Point S3 | 137.04 |
| Daily Pivot Point R1 | 141.62 |
| Daily Pivot Point R2 | 142.56 |
| Daily Pivot Point R3 | 143.91 |
[/s2If]
Join Our Telegram Group
")


