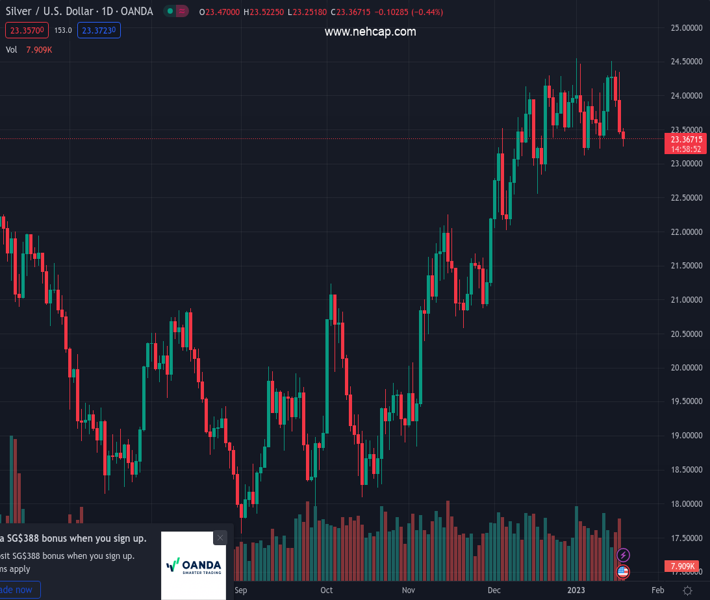
#XAGUSD @ 23.362 Silver extends its descent for the third successive day and drops to over a one-week low. (Pivot Orderbook analysis)
…
This is a premium post.
[s2If !current_user_can(access_s2member_level4)]Please register for PREMIUM VERSION HERE to read full post below containing analysis. In case of any error or you think you are not able to read the full post below, please email us at support#nehcap.com [lwa][/s2If] [s2If current_user_can(access_s2member_level4)]
- Silver extends its descent for the third successive day and drops to over a one-week low.
- The technical setup now favours bearish traders and supports prospects for a further fall.
- A convincing break below the trend-channel support will reaffirm the negative outlook.
The pair currently trades last at 23.362.
The previous day high was 24.35 while the previous day low was 23.42. The daily 38.2% Fib levels comes at 23.78, expected to provide resistance. Similarly, the daily 61.8% fib level is at 23.99, expected to provide resistance.
Silver extends this week’s retracement slide from the $24.50 horizontal resistance and edges lower for the third straight day on Thursday. The white metal remains on the defensive heading into the European session and is currently placed just below the mid-$23.00s, or the 200-period SMA on the 4-hour chart.
Bearish traders now await some follow-through selling below support marked by the lower boundary of over a one-month-old ascending channel before placing fresh bets. Technical indicators on the daily chart have just started gaining negative traction and support prospects for an eventual breakdown. That said, RSI (14) on hourly charts is on the verge of breaking into the oversold zone and warrants some caution.
A convincing break, however, might turn the XAG/USD vulnerable to weaken further below the $23.00 mark and accelerate the fall to the $22.60-$22.55 region. The downward trajectory could get extended further and drag spot prices to the next relevant support near the $22.10-$22.00 zone. The latter represents a static resistance breakpoint and might help limit losses, which if broken will be seen as a fresh trigger for bears.
On the flip side, any meaningful recovery attempt now seems to confront an immediate hurdle ahead of the $24.00 round-figure mark. This is followed by resistance near the $24.30 region and the multi-month peak, around the $24.50 area. A sustained strength beyond has the potential to lift the XAG/USD towards challenging the trend channel barrier, currently around the $24.80-$24.85 zone, en route to the $25.00 psychological mark.
Technical Levels: Supports and Resistances
XAGUSD currently trading at 23.41 at the time of writing. Pair opened at 23.45 and is trading with a change of -0.17 % .
| Overview | Overview.1 | |
|---|---|---|
| 0 | Today last price | 23.41 |
| 1 | Today Daily Change | -0.04 |
| 2 | Today Daily Change % | -0.17 |
| 3 | Today daily open | 23.45 |
The pair is trading below its 20 Daily moving average @ 23.78, above its 50 Daily moving average @ 22.89 , above its 100 Daily moving average @ 21.11 and above its 200 Daily moving average @ 21.06
| Trends | Trends.1 | |
|---|---|---|
| 0 | Daily SMA20 | 23.78 |
| 1 | Daily SMA50 | 22.89 |
| 2 | Daily SMA100 | 21.11 |
| 3 | Daily SMA200 | 21.06 |
The previous day high was 24.35 while the previous day low was 23.42. The daily 38.2% Fib levels comes at 23.78, expected to provide resistance. Similarly, the daily 61.8% fib level is at 23.99, expected to provide resistance.
Note the levels of interest below:
- Pivot support is noted at 23.14, 22.82, 22.21
- Pivot resistance is noted at 24.06, 24.66, 24.98
| Levels | Levels.1 |
|---|---|
| Previous Daily High | 24.35 |
| Previous Daily Low | 23.42 |
| Previous Weekly High | 24.30 |
| Previous Weekly Low | 23.22 |
| Previous Monthly High | 24.30 |
| Previous Monthly Low | 22.03 |
| Daily Fibonacci 38.2% | 23.78 |
| Daily Fibonacci 61.8% | 23.99 |
| Daily Pivot Point S1 | 23.14 |
| Daily Pivot Point S2 | 22.82 |
| Daily Pivot Point S3 | 22.21 |
| Daily Pivot Point R1 | 24.06 |
| Daily Pivot Point R2 | 24.66 |
| Daily Pivot Point R3 | 24.98 |
[/s2If]
Join Our Telegram Group
")


