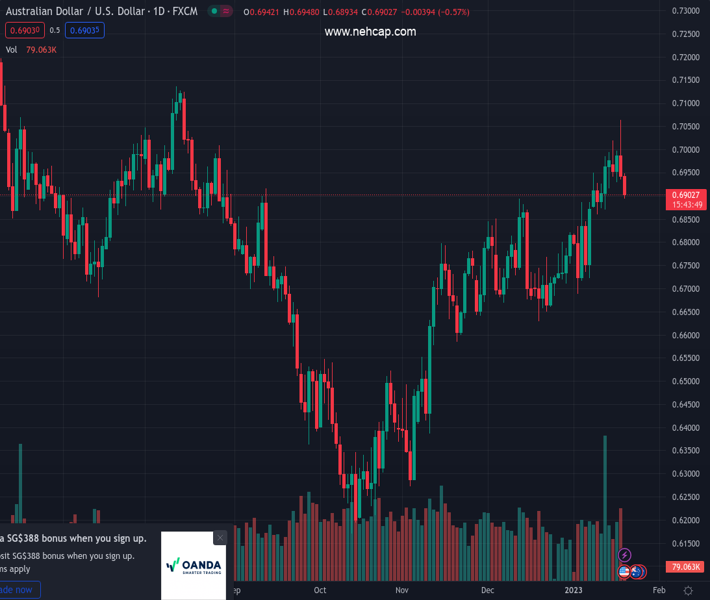
#AUDUSD @ 0.69031 bears poke previous monthly top during a two-day downtrend from five-month high. (Pivot Orderbook analysis)
…
This is a premium post.
[s2If !current_user_can(access_s2member_level4)]Please register for PREMIUM VERSION HERE to read full post below containing analysis. In case of any error or you think you are not able to read the full post below, please email us at support#nehcap.com [lwa][/s2If] [s2If current_user_can(access_s2member_level4)]
- AUD/USD bears poke previous monthly top during a two-day downtrend from five-month high.
- Australia jobs report bolstered case for slower rate hike from the RBA.
- US Treasury bond yields renew multi-day low even as downbeat data, hawkish Fedspeak renew recession fears.
The pair currently trades last at 0.69031.
The previous day high was 0.7064 while the previous day low was 0.6936. The daily 38.2% Fib levels comes at 0.6985, expected to provide resistance. Similarly, the daily 61.8% fib level is at 0.7015, expected to provide resistance.
AUD/USD holds lower ground near the intraday low near 0.6890 as the previous monthly top probes the bears during the second loss-making day amid early Thursday in Europe. In doing so, the Aussie pair extends the previous day’s pullback from the highest levels since August 2022 amid a downbeat Australian employment report for August, as well as growing fears of recession.
Australia’s headline Employment Change turned negative on a seasonally adjusted basis, printing -14.6K figure versus 22.5K expected and 64K prior. Further, the Unemployment Rate also rose to 3.5% compared to the market consensus of witnessing no change in the 3.4% previous readings.
Elsewhere, softer prints of the US data and hawkish Fed talks renew economic slowdown fears and weigh on the sentiment, which in turn exert downside pressure on the risk-barometer AUD/USD pair.
That said, US Retail Sales marked the biggest slump in a year while the Producer Price Index also dropped to the lowest level in six months during December. Further, St. Louis Federal Reserve’s President James Bullard said US interest rates have to rise further to ensure that inflationary pressures recede. On the same line, President of the Federal Reserve Bank of Cleveland Loretta Mester praised the Fed’s actions to tame inflation. Further, Kansas City Fed President Esther George mentioned that the central bank must restore price stability, “that means returning to 2% inflation.” Recently, Dallas Federal Reserve President Lorie Logan supported a slower rate hike pace but also mentioned possibly a higher stopping point.
As the AUD/USD bears cheer the recession woes in the US, as well as fears of a less hawkish Reserve Bank of Australia (RBA) due to the downbeat Aussie jobs report, the pair traders ignore upbeat concerns surrounding China. Recently, Gita Gopinath, the first Deputy Managing Director of the International Monetary Fund (IMF) said, “China could see a sharp recovery in economic growth from the second quarter onwards based on current infection trends after the dismantling of most COVID-19 restrictions.”
Amid these plays, the S&P 500 Futures and Australia’s ASX 200 print mild losses while the US 10-year Treasury yields refresh a four-month low and the two-year counterpart drops to the lowest levels since early October at the latest.
Looking forward, AUD/USD traders should pay attention to the risk catalysts, mainly the central bank speakers amid a light calendar, for clear directions as bears struggle to retake control.
The AUD/USD pair’s confirmation of a two-week-old rising wedge keeps the bears hopeful of witnessing a fresh monthly low.
Also read: AUD/USD Price Analysis: Bears cheer rising wedge confirmation around 0.6900
Technical Levels: Supports and Resistances
AUDUSD currently trading at 0.6898 at the time of writing. Pair opened at 0.6936 and is trading with a change of -0.55% % .
| Overview | Overview.1 | |
|---|---|---|
| 0 | Today last price | 0.6898 |
| 1 | Today Daily Change | -0.0038 |
| 2 | Today Daily Change % | -0.55% |
| 3 | Today daily open | 0.6936 |
The pair remains strongly bullish on the daily timeframe. It trades above its 20 SMA @ 0.6835, 50 SMA 0.6769, 100 SMA @ 0.6638 and 200 SMA @ 0.6824.
| Trends | Trends.1 | |
|---|---|---|
| 0 | Daily SMA20 | 0.6835 |
| 1 | Daily SMA50 | 0.6769 |
| 2 | Daily SMA100 | 0.6638 |
| 3 | Daily SMA200 | 0.6824 |
The previous day high was 0.7064 while the previous day low was 0.6936. The daily 38.2% Fib levels comes at 0.6985, expected to provide resistance. Similarly, the daily 61.8% fib level is at 0.7015, expected to provide resistance.
Note the levels of interest below:
- Pivot support is noted at 0.6893, 0.685, 0.6765
- Pivot resistance is noted at 0.7022, 0.7107, 0.715
| Levels | Levels.1 |
|---|---|
| Previous Daily High | 0.7064 |
| Previous Daily Low | 0.6936 |
| Previous Weekly High | 0.6994 |
| Previous Weekly Low | 0.6860 |
| Previous Monthly High | 0.6893 |
| Previous Monthly Low | 0.6629 |
| Daily Fibonacci 38.2% | 0.6985 |
| Daily Fibonacci 61.8% | 0.7015 |
| Daily Pivot Point S1 | 0.6893 |
| Daily Pivot Point S2 | 0.6850 |
| Daily Pivot Point S3 | 0.6765 |
| Daily Pivot Point R1 | 0.7022 |
| Daily Pivot Point R2 | 0.7107 |
| Daily Pivot Point R3 | 0.7150 |
[/s2If]
Join Our Telegram Group
")


