Market sentiment remains negative as lower US PPI has pushed S&P500 valuations to the expensive side. (Pivot Orderbook analysis)
…
This is a premium post.
[s2If !current_user_can(access_s2member_level4)]Please register for PREMIUM VERSION HERE to read full post below containing analysis. In case of any error or you think you are not able to read the full post below, please email us at support#nehcap.com [lwa][/s2If] [s2If current_user_can(access_s2member_level4)]
- Market sentiment remains negative as lower US PPI has pushed S&P500 valuations to the expensive side.
- Firms have been forced to trim the prices of their offerings to match weaker demand.
- Lower US PPI-inspired downward revision for inflation projections has sent US Treasury yields to a multi-month low.
The pair currently trades last at 3927.52.
The previous day high was 4012.87 while the previous day low was 3925.3. The daily 38.2% Fib levels comes at 3958.75, expected to provide resistance. Similarly, the daily 61.8% fib level is at 3979.42, expected to provide resistance.
Intense sell-off by the market participants in the United States equities after a weak US Producer Price Index (PPI) December report and monthly Retail Sales on Wednesday has been carry-forwarded to Thursday morning. S&P500 futures are facing the heat as firms have been forced to trim the prices of goods and services at their factory gates to maintain equilibrium with declining retail demand.
At the press time, S&P500 futures displayed mild losses and further dropped to near 3,925.00, portraying a deep shrink in investors’ risk appetite.
The headline US PPI dropped to 6.2% against the consensus of 6.8% on an annual basis. And, the core PPI that excludes oil and food prices was trimmed to 5.5% from the expectations of 5.9%. Apart from that, monthly Retail Sales contracted heavily by 1.1% vs. the estimates of -0.8%. As producers have been forced to trim offered prices to maintain the overall sales, valuations of various firms have scaled to the expensive side amidst the earnings season, which forced investors to dump American stocks. This might also force producers to trim the scale of their offerings ahead, which could trigger a slowdown due to a fall in production activities.
Lower-than-anticipated US PPI report is inspiring for a further decline in the inflation projections. This has bolstered the case of deceleration in the pace of hiking interest rates by the Federal Reserve (Fed) in monetary policy meetings ahead.
Reuters reports that Philadelphia Fed President Patrick Harker reiterated on Wednesday that he’s ready for the US central bank to move to 25-basis-point interest rate hikes amid some signs that hot inflation is cooling off.
Technical Levels: Supports and Resistances
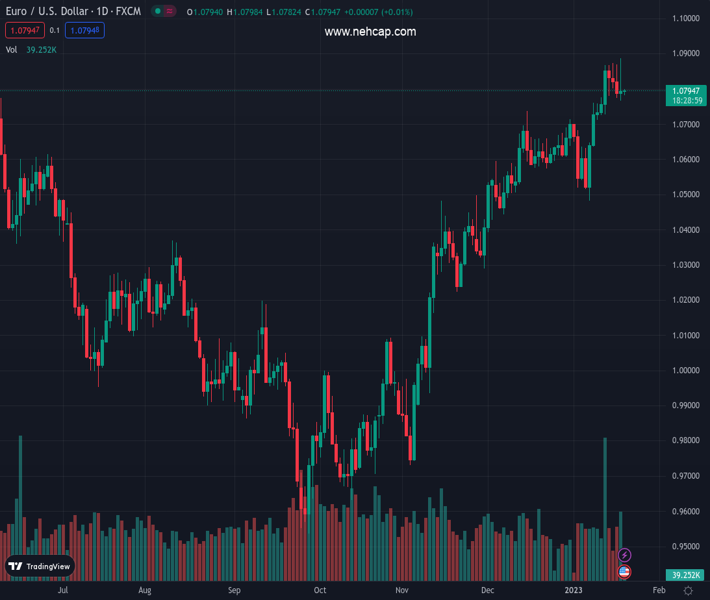
EURUSD currently trading at 3927.52 at the time of writing. Pair opened at 3927.52 and is trading with a change of 0.0 % .
| Overview | Overview.1 | |
|---|---|---|
| 0 | Today last price | 3927.52 |
| 1 | Today Daily Change | 0.00 |
| 2 | Today Daily Change % | 0.00 |
| 3 | Today daily open | 3927.52 |
The pair is trading above its 20 Daily moving average @ 3885.5, below its 50 Daily moving average @ 3933.55 , above its 100 Daily moving average @ 3862.54 and below its 200 Daily moving average @ 3951.29
| Trends | Trends.1 | |
|---|---|---|
| 0 | Daily SMA20 | 3885.50 |
| 1 | Daily SMA50 | 3933.55 |
| 2 | Daily SMA100 | 3862.54 |
| 3 | Daily SMA200 | 3951.29 |
The previous day high was 4012.87 while the previous day low was 3925.3. The daily 38.2% Fib levels comes at 3958.75, expected to provide resistance. Similarly, the daily 61.8% fib level is at 3979.42, expected to provide resistance.
Note the levels of interest below:
- Pivot support is noted at 3897.59, 3867.66, 3810.02
- Pivot resistance is noted at 3985.16, 4042.8, 4072.73
| Levels | Levels.1 |
|---|---|
| Previous Daily High | 4012.87 |
| Previous Daily Low | 3925.30 |
| Previous Weekly High | 4003.12 |
| Previous Weekly Low | 3869.65 |
| Previous Monthly High | 4116.92 |
| Previous Monthly Low | 3761.43 |
| Daily Fibonacci 38.2% | 3958.75 |
| Daily Fibonacci 61.8% | 3979.42 |
| Daily Pivot Point S1 | 3897.59 |
| Daily Pivot Point S2 | 3867.66 |
| Daily Pivot Point S3 | 3810.02 |
| Daily Pivot Point R1 | 3985.16 |
| Daily Pivot Point R2 | 4042.80 |
| Daily Pivot Point R3 | 4072.73 |
[/s2If]
Join Our Telegram Group
")


