#AUDUSD @ 0.69065 extends the previous day’s pullback from five-month high, renews weekly low., @nehcap view: Further downside expected (Pivot Orderbook analysis)
…
This is a premium post.
[s2If !current_user_can(access_s2member_level4)]Please register for PREMIUM VERSION HERE to read full post below containing analysis. In case of any error or you think you are not able to read the full post below, please email us at support#nehcap.com [lwa][/s2If] [s2If current_user_can(access_s2member_level4)]
- AUD/USD extends the previous day’s pullback from five-month high, renews weekly low.
- Confirmation of bearish chart pattern, sustained break of 50-SMA favor sellers.
- 200-SMA, monthly support line probe bears even as oscillators suggest further downside.
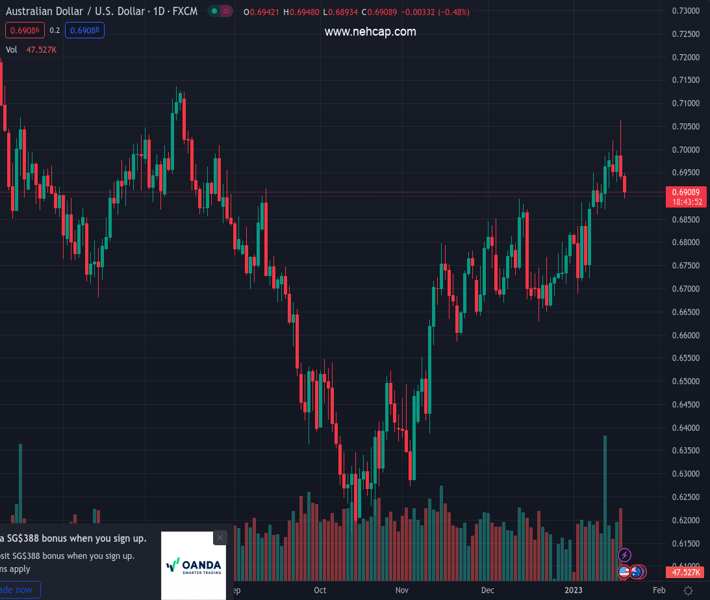
The pair currently trades last at 0.69065.
The previous day high was 0.7064 while the previous day low was 0.6936. The daily 38.2% Fib levels comes at 0.6985, expected to provide resistance. Similarly, the daily 61.8% fib level is at 0.7015, expected to provide resistance.
AUD/USD remains on the back foot for the second consecutive day after refreshing the multi-month high, down half a percent as bears poke the 0.6900 threshold during early Thursday.
In doing so, the Aussie pair justifies the previous confirmation of the two-week-old rising wedge bearish chart pattern, as well as the 50-SMA breakdown.
Also favoring the AUD/USD pair in refreshing the weekly low is the downbeat RSI (14) line, not oversold, as well as the bearish MACD signals.
That said, the rising wedge confirmation signals the theoretical target of around 0.6630 but the RSI line has limited room before it hits the oversold territory. As a result, the 200-SMA and an upward-sloping support line from December 20, 2022, respectively near 0.6800 and 0.6785, could challenge the AUD/USD sellers.
Meanwhile, recovery moves need to cross the 50-SMA hurdle of 0.6945 to restore bullish confidence.
Following that, the lower line of the stated wedge, close to 0.6980, precedes the 0.7000 psychological magnet to probe the upside momentum.
In a case where the AUD/USD price remains firmer past 0.7000, the monthly high of 0.7065 and the August 2022 peak surrounding 0.7135, will gain the market’s attention.
Overall, AUD/USD is likely to decline further but the downside room appears limited.
Trend: Further downside expected
Technical Levels: Supports and Resistances
AUDUSD currently trading at 0.6906 at the time of writing. Pair opened at 0.6936 and is trading with a change of -0.43% % .
| Overview | Overview.1 | |
|---|---|---|
| 0 | Today last price | 0.6906 |
| 1 | Today Daily Change | -0.0030 |
| 2 | Today Daily Change % | -0.43% |
| 3 | Today daily open | 0.6936 |
The pair remains strongly bullish on the daily timeframe. It trades above its 20 SMA @ 0.6835, 50 SMA 0.6769, 100 SMA @ 0.6638 and 200 SMA @ 0.6824.
| Trends | Trends.1 | |
|---|---|---|
| 0 | Daily SMA20 | 0.6835 |
| 1 | Daily SMA50 | 0.6769 |
| 2 | Daily SMA100 | 0.6638 |
| 3 | Daily SMA200 | 0.6824 |
The previous day high was 0.7064 while the previous day low was 0.6936. The daily 38.2% Fib levels comes at 0.6985, expected to provide resistance. Similarly, the daily 61.8% fib level is at 0.7015, expected to provide resistance.
Note the levels of interest below:
- Pivot support is noted at 0.6893, 0.685, 0.6765
- Pivot resistance is noted at 0.7022, 0.7107, 0.715
| Levels | Levels.1 |
|---|---|
| Previous Daily High | 0.7064 |
| Previous Daily Low | 0.6936 |
| Previous Weekly High | 0.6994 |
| Previous Weekly Low | 0.6860 |
| Previous Monthly High | 0.6893 |
| Previous Monthly Low | 0.6629 |
| Daily Fibonacci 38.2% | 0.6985 |
| Daily Fibonacci 61.8% | 0.7015 |
| Daily Pivot Point S1 | 0.6893 |
| Daily Pivot Point S2 | 0.6850 |
| Daily Pivot Point S3 | 0.6765 |
| Daily Pivot Point R1 | 0.7022 |
| Daily Pivot Point R2 | 0.7107 |
| Daily Pivot Point R3 | 0.7150 |
[/s2If]
Join Our Telegram Group
")


