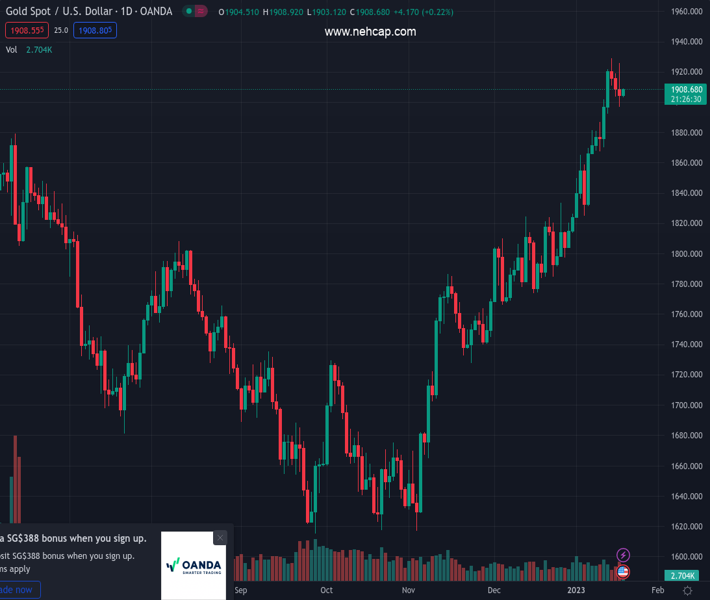
#XAUUSD @ 1,908.54 Gold price picks up bids to justify the bullish technical formation., @nehcap view: Limited upside expected (Pivot Orderbook analysis)
…
This is a premium post.
[s2If !current_user_can(access_s2member_level4)]Please register for PREMIUM VERSION HERE to read full post below containing analysis. In case of any error or you think you are not able to read the full post below, please email us at support#nehcap.com [lwa][/s2If] [s2If current_user_can(access_s2member_level4)]
- Gold price picks up bids to justify the bullish technical formation.
- US Dollar’s failure to keep late Wednesday’s rebound adds strength to the XAU/USD rebound.
- US recession woes contradict the Fed talks while mixed concerns over China also probe Gold buyers.
The pair currently trades last at 1908.54.
The previous day high was 1925.95 while the previous day low was 1896.63. The daily 38.2% Fib levels comes at 1907.83, expected to provide support. Similarly, the daily 61.8% fib level is at 1914.75, expected to provide resistance.
Gold price (XAU/USD) picks up bids to pare the previous day’s losses, snapping a three-day downtrend, as the US Dollar fails to defend the late Wednesday’s corrective bounce off the lowest level since May 31, 2022. Adding strength to the XAU/USD rebound could be the recent comments from Dallas Federal Reserve (Fed) President Lorie Logan.
While most of the Fed policymakers appeared hawkish on Wednesday, Fed’s Logan supported a slower rate hike pace but also mentioned possibly a higher stopping point during her first speech as the Fed representative.
Previously, St. Louis Federal Reserve’s President James Bullard said US interest rates have to rise further to ensure that inflationary pressures recede. On the same line, President of the Federal Reserve Bank of Cleveland Loretta Mester praised the Fed’s actions to tame inflation. Further, Kansas City Fed President Esther George mentioned that the central bank must restore price stability, “that means returning to 2% inflation.”
It should be noted that the downbeat US data allowed the Gold traders to regain upside momentum and probe the Fed hawks. That said, the Bank of Japan’s (BOJ) surprise inaction but the receding fears of the Federal Reserve’s (Fed) aggressive monetary policy actions also drowned the United States Treasury bond yields on Wednesday. That said, the BOJ left monetary policy and the interest rates unchanged but the US 10-year Treasury bond yields dropped the most in 10 weeks, pressured around the four-month low near 3.37% by the press time. As a result, the US Dollar Index traces the US Treasury bond yields amid the mixed signals from the Fed.
Elsewhere, mixed concerns surrounding China seemed to have probed the Gold buyers as Analysts at Goldman Sachs expected stronger China growth and favored hopes of more energy demand from the dragon nation. However, fears of the US-China tension outweigh the optimism of late. US Treasury Secretary Janet Yellen and Chinese China’s Vice Premier Liu He met in Germany on Wednesday and initially boosted the risk appetite, together with the BOJ’s inaction. However, the diplomats’ mentioning of the areas of disagreement raised market fears of another round of US-China tension. Ahead of that, the South China Morning Post (SCMP) mentioned that Beijing ‘should be wary’ as the US and Taiwan seeks closer economic ties.
It should be noted that the downbeat US Treasury bond yields put a floor under the Gold price. The Bank of Japan’s (BOJ) surprise inaction and receding fears of the Federal Reserve’s (Fed) aggressive monetary policy actions drowned the United States Treasury bond yields on Wednesday. That said, the BOJ left monetary policy and the interest rates unchanged but the US 10-year Treasury bond yields dropped the most in 10 weeks, pressured around the four-month low near 3.37% by the press time.
Amid these plays, markets remain cautiously optimistic and hence the Gold price recovers amid a light calendar of Thursday. The market sentiment could be witnessed by mildly bid US stock futures, softer US Dollar Index (DXY) and the downbeat US Treasury bond yields.
Gold price bounces off support line of a two-week-old ascending trend channel as it prints mild gains amid a sluggish session. It’s worth noting that the receding bearish bias of the MACD And the steady RSI also back the XAU/USD’s defence of the bullish chart pattern and suggest further advances.
However, the weekly resistance line near $1,925 restricts immediate upside of the XAU/USD, a break of which could challenge the nine-month high marked earlier in the week surrounding $1,930.
It’s should be observed, however, that the aforementioned channel’s top-line, close to $1,950, will challenge the Gold buyers afterward.
Alternatively, a downside break of the channel’s lower line, around $1,902 at the latest, could quickly drag the Gold price towards the 100-SMA level near $1,863.
Following that, a five-week-old horizontal support area near $1,825-23 will gain the XAU/USD trader’s attention.
Trend: Limited upside expected
Technical Levels: Supports and Resistances
XAUUSD currently trading at 1908.36 at the time of writing. Pair opened at 1903.47 and is trading with a change of 0.26% % .
| Overview | Overview.1 | |
|---|---|---|
| 0 | Today last price | 1908.36 |
| 1 | Today Daily Change | 4.89 |
| 2 | Today Daily Change % | 0.26% |
| 3 | Today daily open | 1903.47 |
The pair remains strongly bullish on the daily timeframe. It trades above its 20 SMA @ 1851.62, 50 SMA 1805.76, 100 SMA @ 1739.63 and 200 SMA @ 1776.42.
| Trends | Trends.1 | |
|---|---|---|
| 0 | Daily SMA20 | 1851.62 |
| 1 | Daily SMA50 | 1805.76 |
| 2 | Daily SMA100 | 1739.63 |
| 3 | Daily SMA200 | 1776.42 |
The previous day high was 1925.95 while the previous day low was 1896.63. The daily 38.2% Fib levels comes at 1907.83, expected to provide support. Similarly, the daily 61.8% fib level is at 1914.75, expected to provide resistance.
Note the levels of interest below:
- Pivot support is noted at 1891.42, 1879.36, 1862.1
- Pivot resistance is noted at 1920.74, 1938.0, 1950.06
| Levels | Levels.1 |
|---|---|
| Previous Daily High | 1925.95 |
| Previous Daily Low | 1896.63 |
| Previous Weekly High | 1921.96 |
| Previous Weekly Low | 1865.22 |
| Previous Monthly High | 1833.38 |
| Previous Monthly Low | 1765.89 |
| Daily Fibonacci 38.2% | 1907.83 |
| Daily Fibonacci 61.8% | 1914.75 |
| Daily Pivot Point S1 | 1891.42 |
| Daily Pivot Point S2 | 1879.36 |
| Daily Pivot Point S3 | 1862.10 |
| Daily Pivot Point R1 | 1920.74 |
| Daily Pivot Point R2 | 1938.00 |
| Daily Pivot Point R3 | 1950.06 |
[/s2If]
Join Our Telegram Group
")


