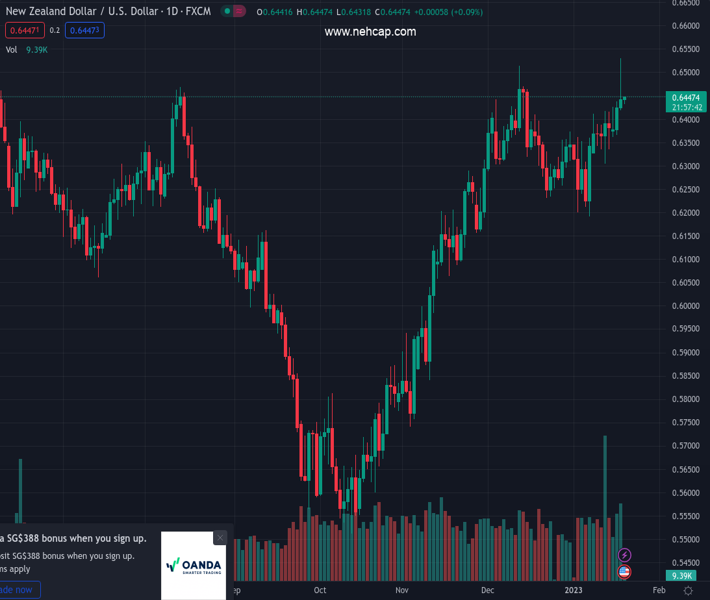
#NZDUSD @ 0.64450 Hawkish commentaries from Fed policymakers have infused fresh blood into the US Dollar. (Pivot Orderbook analysis)
…
This is a premium post.
[s2If !current_user_can(access_s2member_level4)]Please register for PREMIUM VERSION HERE to read full post below containing analysis. In case of any error or you think you are not able to read the full post below, please email us at support#nehcap.com [lwa][/s2If] [s2If current_user_can(access_s2member_level4)]
- Hawkish commentaries from Fed policymakers have infused fresh blood into the US Dollar.
- A Spinning Top formation indicates indecisiveness in investors’ sentiment for further action.
- Upward-sloping 20-EMA and oscillation of the RSI (14) in the bullish range still favor the upside bias.
The pair currently trades last at 0.64450.
The previous day high was 0.6438 while the previous day low was 0.6366. The daily 38.2% Fib levels comes at 0.6411, expected to provide support. Similarly, the daily 61.8% fib level is at 0.6394, expected to provide support.
The NZD/USD pair is displaying a sideways auction profile in the early Asian session after a sell-off from above the psychological resistance of 0.6500 on Wednesday. The Kiwi asset is expected to witness pressure ahead as the risk appetite of the market participants has dropped vigorously after hawkish commentaries from Federal Reserve (Fed) policymakers.
S&P500 witnessed a massive sell-off amidst earnings season as lower bargaining power in the favor of producers will trim operating margins. Also, lower inflation projections due to the soft Producers Price Index (PPI) report were responsible for a plunge in the 10-year US Treasury yields to 3.37%. The US Dollar Index (DXY) is juggling around 102.00 after a V-shape recovery from a fresh seven-month low at 101.20.
NZD/USD is demonstrating signs of a bearish reversal led by the formation of a Spinning Top candlestick pattern. The aforementioned candlestick indicates indecisiveness in the sentiment of investors for further action, which also marks a reversal in the ongoing trend.
Other filters such as Exponential Moving Averages and momentum oscillators have not displayed signs of reversal yet, due to their lagging characteristic.
The 20-period EMA at 0.6366 is still upward-sloping, which adds to the upside filters.
Meanwhile, the Relative Strength Index (RSI) (14) has shifted into the bullish range of 60.00-80.00 but still needs to sustain above for bullish momentum.
For a downside move, a breakdown below January 16 high at 0.6426 will drag the Kiwi asset toward January 17 low at 0.6366 followed by January 12 low around 0.6300.
On the contrary, a decisive break above Wednesday’s high at 0.6530 will drive the asset toward June 3 high at 0.6576. A breach of the latter will expose the asset to the round-level resistance at 0.6600.
Technical Levels: Supports and Resistances
NZDUSD currently trading at 0.6443 at the time of writing. Pair opened at 0.6428 and is trading with a change of 0.23 % .
| Overview | Overview.1 | |
|---|---|---|
| 0 | Today last price | 0.6443 |
| 1 | Today Daily Change | 0.0015 |
| 2 | Today Daily Change % | 0.2300 |
| 3 | Today daily open | 0.6428 |
The pair remains strongly bullish on the daily timeframe. It trades above its 20 SMA @ 0.6328, 50 SMA 0.6285, 100 SMA @ 0.6054 and 200 SMA @ 0.6206.
| Trends | Trends.1 | |
|---|---|---|
| 0 | Daily SMA20 | 0.6328 |
| 1 | Daily SMA50 | 0.6285 |
| 2 | Daily SMA100 | 0.6054 |
| 3 | Daily SMA200 | 0.6206 |
The previous day high was 0.6438 while the previous day low was 0.6366. The daily 38.2% Fib levels comes at 0.6411, expected to provide support. Similarly, the daily 61.8% fib level is at 0.6394, expected to provide support.
Note the levels of interest below:
- Pivot support is noted at 0.6383, 0.6338, 0.6311
- Pivot resistance is noted at 0.6456, 0.6483, 0.6528
| Levels | Levels.1 |
|---|---|
| Previous Daily High | 0.6438 |
| Previous Daily Low | 0.6366 |
| Previous Weekly High | 0.6418 |
| Previous Weekly Low | 0.6314 |
| Previous Monthly High | 0.6514 |
| Previous Monthly Low | 0.6230 |
| Daily Fibonacci 38.2% | 0.6411 |
| Daily Fibonacci 61.8% | 0.6394 |
| Daily Pivot Point S1 | 0.6383 |
| Daily Pivot Point S2 | 0.6338 |
| Daily Pivot Point S3 | 0.6311 |
| Daily Pivot Point R1 | 0.6456 |
| Daily Pivot Point R2 | 0.6483 |
| Daily Pivot Point R3 | 0.6528 |
[/s2If]
Join Our Telegram Group
")


