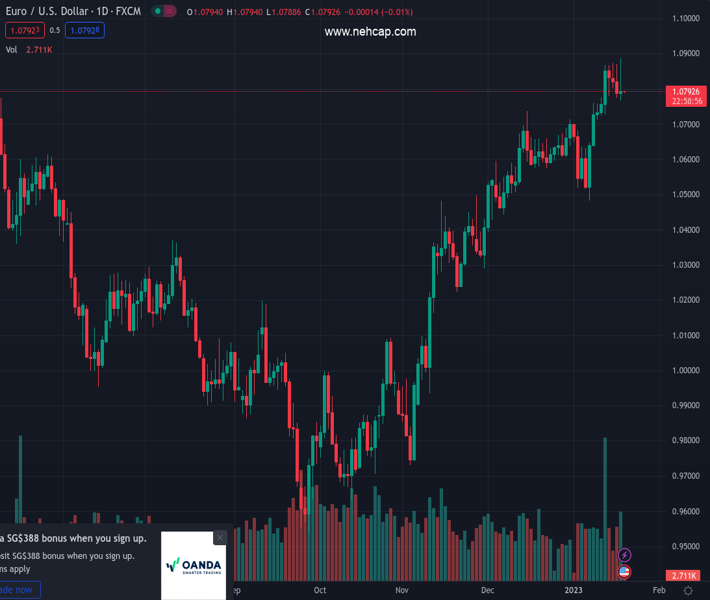
#EURUSD @ 1.07932 holds lower ground inside a one-week-old bullish chart pattern., @nehcap view: Further downside expected (Pivot Orderbook analysis)
…
This is a premium post.
[s2If !current_user_can(access_s2member_level4)]Please register for PREMIUM VERSION HERE to read full post below containing analysis. In case of any error or you think you are not able to read the full post below, please email us at support#nehcap.com [lwa][/s2If] [s2If current_user_can(access_s2member_level4)]
- EUR/USD holds lower ground inside a one-week-old bullish chart pattern.
- 50-SMA restricts immediate downside but bearish MACD signals, steady RSI hints at further weakness.
- Monthly horizontal support, 200-SMA add to the downside filters.
- Bulls need validation from 1.0890 to break the monotony.
The pair currently trades last at 1.07932.
The previous day high was 1.0869 while the previous day low was 1.0774. The daily 38.2% Fib levels comes at 1.0811, expected to provide resistance. Similarly, the daily 61.8% fib level is at 1.0833, expected to provide resistance.
EUR/USD stays pressured around 1.0790 amid the early hours of Thursday’s Asian session, after refreshing the nine-month high but posting a daily negative. In doing so, the major currency pair remains inside a weekly bullish channel, poking the 50-SMA immediate support as of late.
However, the bearish MACD signals and steady RSI (14), not to forget the weekly trading range, keeps the EUR/USD sellers hopeful of breaking the 1.0780 immediate support and approaching the 1.0770 key level comprising the stated channel’s lower line.
It’s worth noting that the quote’s weakness past 1.0770 could quickly drag it to the horizontal area comprising levels marked since 2022’s end, around 1.0710. Following that, the 200-SMA level of 1.0642 could probe the EUR/USD bears.
Alternatively, recovery moves may initially aim for the 1.0830 hurdle before challenging the aforementioned channel’s top line, close to 1.0890 by the press time.
Also acting as an upside filter is the 1.0900 threshold, a break of which could propel the EUR/USD prices towards poking the April 2022 peak near 1.0935. Even so, lows marked during late March 2022, around 1.0945 could challenge the EUR/USD buyers afterward.
Trend: Further downside expected
Technical Levels: Supports and Resistances
EURUSD currently trading at 1.0792 at the time of writing. Pair opened at 1.0794 and is trading with a change of -0.02% % .
| Overview | Overview.1 | |
|---|---|---|
| 0 | Today last price | 1.0792 |
| 1 | Today Daily Change | -0.0002 |
| 2 | Today Daily Change % | -0.02% |
| 3 | Today daily open | 1.0794 |
The pair remains strongly bullish on the daily timeframe. It trades above its 20 SMA @ 1.0678, 50 SMA 1.0533, 100 SMA @ 1.0206 and 200 SMA @ 1.031.
| Trends | Trends.1 | |
|---|---|---|
| 0 | Daily SMA20 | 1.0678 |
| 1 | Daily SMA50 | 1.0533 |
| 2 | Daily SMA100 | 1.0206 |
| 3 | Daily SMA200 | 1.0310 |
The previous day high was 1.0869 while the previous day low was 1.0774. The daily 38.2% Fib levels comes at 1.0811, expected to provide resistance. Similarly, the daily 61.8% fib level is at 1.0833, expected to provide resistance.
Note the levels of interest below:
- Pivot support is noted at 1.0756, 1.0718, 1.0661
- Pivot resistance is noted at 1.0851, 1.0908, 1.0946
| Levels | Levels.1 |
|---|---|
| Previous Daily High | 1.0869 |
| Previous Daily Low | 1.0774 |
| Previous Weekly High | 1.0868 |
| Previous Weekly Low | 1.0639 |
| Previous Monthly High | 1.0736 |
| Previous Monthly Low | 1.0393 |
| Daily Fibonacci 38.2% | 1.0811 |
| Daily Fibonacci 61.8% | 1.0833 |
| Daily Pivot Point S1 | 1.0756 |
| Daily Pivot Point S2 | 1.0718 |
| Daily Pivot Point S3 | 1.0661 |
| Daily Pivot Point R1 | 1.0851 |
| Daily Pivot Point R2 | 1.0908 |
| Daily Pivot Point R3 | 1.0946 |
[/s2If]
Join Our Telegram Group
")


